Home Blog Page 3

Dow Jones Surges After Powell’s Jackson Hole Speech as Tariff Impact Looms

21

Introduction

The Dow Jones Industrial Average (DJI) posted a sharp rally on Friday, surging nearly 756 points (+1.69%) to close at 45,541.49, as investors digested Federal Reserve Chair Jerome Powell’s remarks at the Jackson Hole symposium. Powell cautioned that the effects of tariffs will accumulate over the coming months and may persist, sparking both optimism about the Fed’s awareness of risks and caution over inflation’s trajectory. Against this backdrop, the Dow’s technical breakout above key resistance levels signals a renewed bullish sentiment on Wall Street.


Strong Rally in Dow Jones After Weeks of Volatility

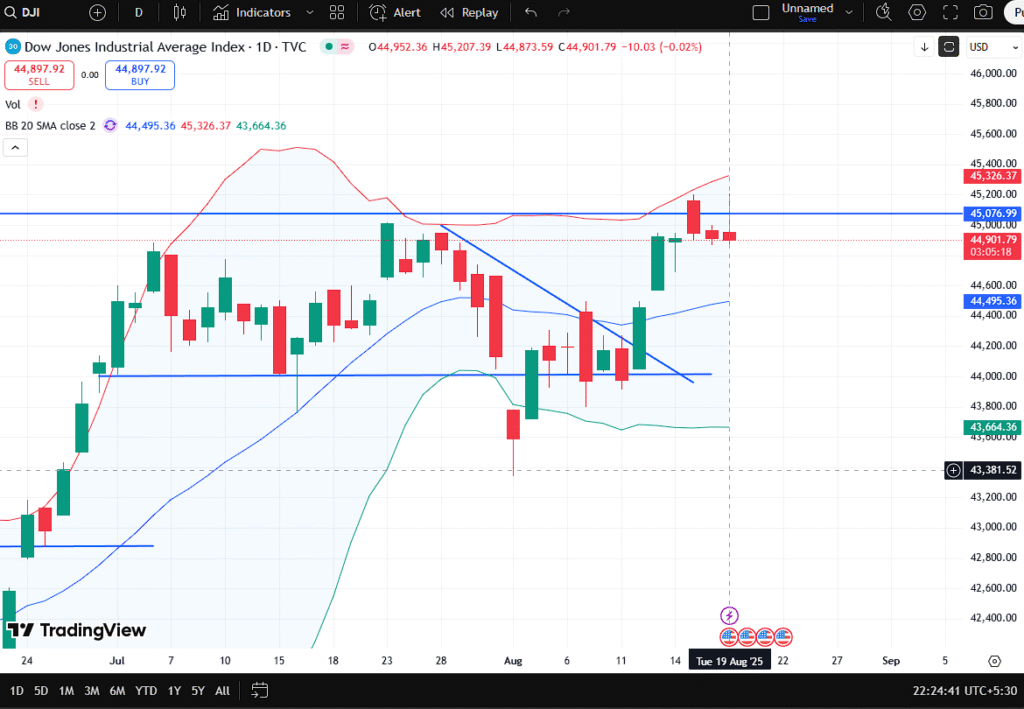
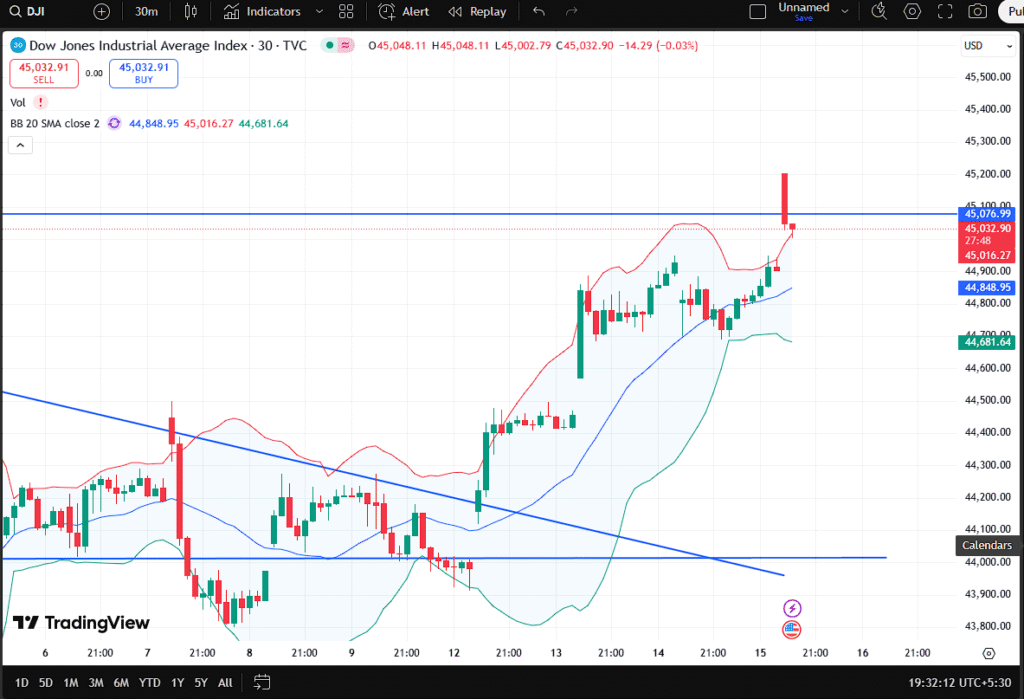
Friday’s trading session marked one of the most significant daily moves for the Dow in recent weeks. After oscillating within a range and struggling with overhead resistance, the index finally broke out, closing well above the 45,076 pivot zone. This move was accompanied by strong trading volumes and bullish candles, indicating robust buying momentum.

The Bollinger Bands suggest heightened volatility, with the price now testing the upper band near 45,462. Historically, such breakouts often precede follow-through gains, though traders must also watch for overbought conditions. The Dow’s current level above its 20-day moving average (44,529) reinforces a positive near-term outlook.


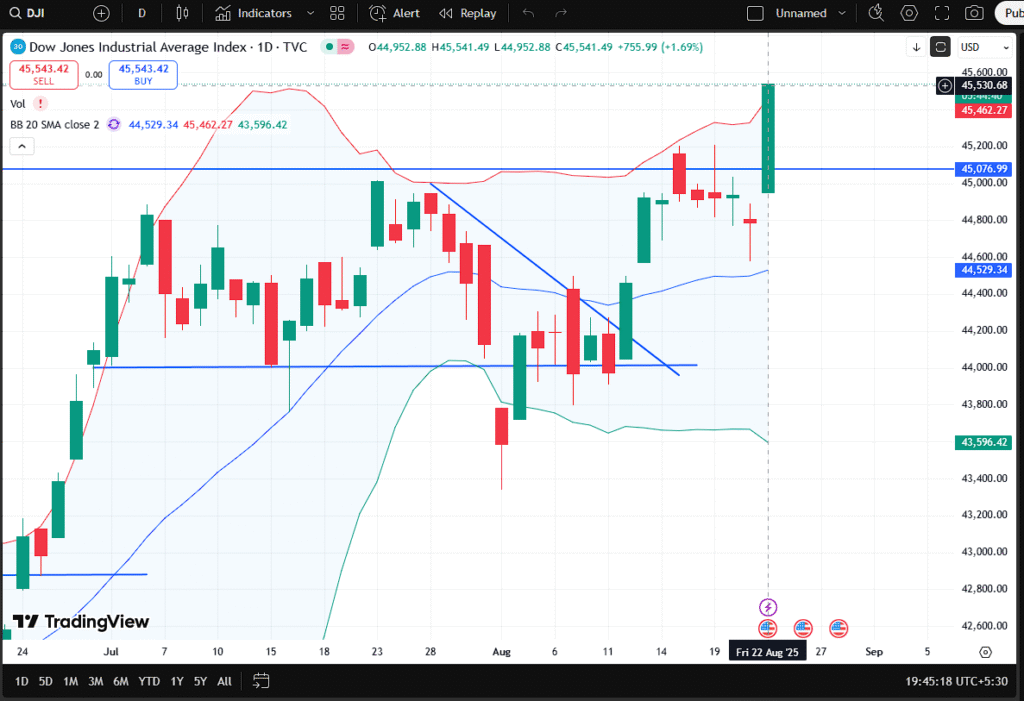
Dow Jones Industrial Average daily chart showing breakout above resistance after Powell’s Jackson Hole remarks.


Technical Analysis Points to Bullish Continuation

The Dow’s recent breakout holds significance for traders and long-term investors alike. For weeks, the index was trapped between 44,000 and 45,000, with sellers defending higher levels. Friday’s move decisively cleared this hurdle.

From a charting perspective:

  • Resistance Breakout: The Dow surged past 45,076, a critical resistance level. A daily close above this zone confirms bullish sentiment.
  • Moving Averages: The 20-day SMA at 44,529 now acts as strong support, reducing downside risk in the short term.
  • Bollinger Bands: With the price near the upper band (45,462), momentum traders may eye further upside, but caution is warranted against potential pullbacks.
  • Volume Confirmation: The rally was backed by higher-than-average volumes, signaling conviction among market participants.

Market analysts suggest that if the Dow sustains above 45,000, the next target could be 46,000–46,200. Conversely, a failure to hold current levels could drag the index back toward 44,500 support.


Powell’s Jackson Hole Message: Tariffs Could Fuel Sticky Inflation

At the Jackson Hole symposium, Powell acknowledged that tariffs are inflationary but stressed that their impact would not appear “all at once.” Instead, he warned that the effects would accumulate over time, potentially keeping inflation elevated longer than expected.

His statement—“a one-time shift in prices doesn’t mean all at once; maybe persist”—highlighted the Fed’s concern that supply-side shocks could complicate the disinflationary path. Investors took this as a balanced message: the Fed is cautious about inflation risks but also aware of the need to manage growth and avoid overtightening.

Economists noted that Powell’s remarks add a new layer of complexity to the Fed’s policy outlook. Tariffs, unlike demand-driven inflation, are harder to counter with interest rates. They act as a tax on consumers and businesses, raising costs across sectors.


Market Reaction and Sector Performance

The Dow’s surge reflected optimism that the Fed will remain data-dependent rather than adopt a pre-set tightening bias. Traders bet that the central bank will carefully weigh the persistence of tariff-driven inflation before deciding on future rate actions.

Sector-wise, gains were broad-based:

  • Technology & Industrials: Benefited the most, as optimism over growth and resilience returned.
  • Consumer Discretionary: Rose sharply on hopes that spending will remain stable despite higher tariffs.
  • Financials: Gained as bond yields moderated, reducing recession fears.

The rally in the Dow mirrors a broader risk-on sentiment in global equities, though some strategists warned that the persistence of tariffs could eventually pressure margins and consumer demand.


The Bigger Picture: Can the Bull Run Continue?

The current breakout in the Dow Jones is technically strong, but investors remain cautious. Tariffs and persistent inflation could limit upside momentum if earnings begin to show cracks. At the same time, the Fed’s acknowledgment of supply-driven risks without signaling immediate aggressive action provided a psychological boost to markets.

Historically, Jackson Hole speeches have marked turning points in Fed policy. Powell’s latest remarks fall into the “measured caution” category, suggesting no rush to cut or hike rates. That balance allowed markets to breathe a sigh of relief.


Future Outlook: Opportunities and Risks Ahead

Looking ahead, the Dow Jones faces both opportunities and risks:

  • Opportunities: Sustained momentum above 45,000 could attract more institutional buying, targeting 46,200 and beyond. Improved earnings and resilient consumer spending could further fuel gains.
  • Risks: Tariffs remain a wildcard. If inflation persists, the Fed may need to delay or scale back any potential rate cuts. Additionally, global geopolitical tensions and slowing growth in China could weigh on sentiment.

For traders, risk management will be key. The breakout offers opportunities, but volatility around tariff news and Fed communications will likely remain high. Long-term investors may view pullbacks as buying opportunities, provided the Dow holds above its key support zones.


Conclusion: Dow’s Breakout Marks a Turning Point, but Risks Persist

The Dow’s 756-point rally on Friday marks a significant technical and psychological milestone for investors. Powell’s Jackson Hole remarks struck a careful balance—acknowledging risks from tariffs without triggering panic over runaway inflation. The result was a risk-on rally across Wall Street.

Still, the road ahead is uncertain. Persistent tariffs, sticky inflation, and geopolitical risks remain challenges. For now, however, the market has chosen optimism, betting on resilience and the Fed’s steady hand.


Disclaimer

This article is for informational purposes only and does not constitute financial advice. Investors should consult a professional advisor before making investment decisions.

Top 50 Crypto Coins

Bitcoin Price Struggles Below $115K: Can the Bulls Regain Momentum?

8

Introduction

Bitcoin, the world’s largest cryptocurrency, has entered a crucial trading zone as prices hover near $112,000. After facing strong resistance at $125,000 earlier this month, BTC has slipped below key support levels, raising concerns among investors about the possibility of a deeper correction. Technical indicators suggest increased volatility, while traders are now debating whether this dip represents a buying opportunity or a warning signal of further downside risk.


Bitcoin Faces Heavy Selling Pressure Amid Market Uncertainty

Over the past week, Bitcoin has seen heavy selling pressure, with its price falling below the $116,000 level that previously acted as strong support. The daily chart indicates that BTC has been unable to hold above its 20-day and 50-day moving averages, both of which are now trending downward.

“Bitcoin’s rejection near $125,000 was a significant event,” noted crypto analyst David Marcus. “It shows that the market is still struggling with macroeconomic uncertainties, regulatory developments, and declining risk appetite among institutional players.”

The sharp correction has also triggered liquidations in leveraged positions across major exchanges, intensifying the bearish move. Meanwhile, altcoins have mirrored Bitcoin’s weakness, further signaling a broad risk-off sentiment in the digital asset market.

Bitcoin daily chart showing rejection near $125,000 and decline toward $112,000 support.


The Technical Outlook: Key Levels to Watch

Bitcoin’s current technical setup shows a battle between buyers and sellers near the $111,000–$112,000 support zone. A decisive breakdown below this region could open the door to further declines, potentially toward $108,000 and $105,000. On the upside, the $116,500 and $120,000 levels remain key resistance points that bulls must reclaim to re-establish control.

Bollinger Bands on the daily chart indicate widening volatility, suggesting that a sharp move could be imminent. The Relative Strength Index (RSI) has entered a neutral-to-oversold zone, meaning a bounce cannot be ruled out. Traders with a short-term view may look for quick rebounds, but the broader trend remains fragile unless BTC breaks back above $120,000.

Institutional flows will also play a vital role. If exchange-traded products or large-scale investors start accumulating during this dip, the market could see renewed bullish sentiment. However, if outflows persist, the correction may deepen, erasing much of the recent rally.


Macroeconomic Factors Impacting Bitcoin

Beyond technical signals, Bitcoin’s price action is heavily influenced by global economic conditions. The U.S. Federal Reserve’s cautious stance on interest rates, rising government debt concerns, and geopolitical tensions have created a mixed environment for risk assets like cryptocurrencies.

In July, Bitcoin briefly rallied alongside tech stocks as hopes of rate cuts grew. However, fresh inflation data and hawkish Fed commentary quickly erased gains. Investors are now questioning whether Bitcoin can maintain its reputation as “digital gold” or if it will continue to trade like a high-risk asset tied to global liquidity.

“Bitcoin is caught in the crossfire of macro uncertainty,” said investment strategist Clara Johnson. “On one hand, long-term believers see every dip as a chance to accumulate. On the other hand, traders worried about liquidity tightening are unwilling to hold volatile assets.”

Meanwhile, developments in Asia and Europe are also shaping market sentiment. Japan’s central bank has hinted at possible adjustments to its bond-buying program, while the European Central Bank continues to warn about inflationary risks. Each of these moves indirectly impacts the global appetite for Bitcoin.


Bitcoin’s Next Move: Consolidation or Deeper Correction?

The next few weeks will be critical for Bitcoin. If bulls manage to defend the $111,000–$112,000 support and push prices back above $116,000, a consolidation phase between $116,000 and $120,000 may follow. This would give the market breathing room before attempting another breakout above $125,000.

However, if the selling pressure continues, BTC could face a deeper correction toward $105,000, a level that aligns with the lower Bollinger Band and historical support. Such a drop could shake short-term investors but may also attract long-term holders who view Bitcoin as undervalued below $110,000.


Future Outlook: Long-Term Holders Remain Confident

Despite near-term volatility, long-term holders remain optimistic about Bitcoin’s future. On-chain data suggests that a significant portion of BTC supply remains inactive, indicating that core investors are not rushing to sell. Additionally, upcoming developments such as Bitcoin halving events, institutional adoption, and expanding blockchain infrastructure continue to support a bullish long-term narrative.

The crypto market has historically experienced sharp corrections followed by powerful rallies, and many believe this cycle will be no different. Whether Bitcoin consolidates above $110,000 or dips further, long-term believers argue that its scarcity and decentralized nature will drive demand in the years ahead.


Conclusion

Bitcoin’s struggle near $112,000 highlights the ongoing tug-of-war between bullish optimism and bearish pressure. With technical charts flashing mixed signals and macroeconomic factors weighing heavily on sentiment, traders must stay cautious in the short term. Yet, for long-term investors, every correction continues to present an opportunity to accumulate the world’s most valuable cryptocurrency.


Disclaimer

This article is for informational purposes only and should not be considered financial advice. Cryptocurrency investments carry significant risks. Readers should conduct their own research or consult a financial advisor before making investment decisions.

Top 5o Crypto coins

Target Appoints Michael Fiddelke as New CEO Amid Struggles to Revive Sales

14

Introduction
US retail giant Target Corporation has announced a major leadership change, naming its Chief Operating Officer, Michael Fiddelke, as the company’s next Chief Executive Officer. Fiddelke, who has spent two decades with the retailer, will replace long-serving CEO Brian Cornell in February after his 10-year tenure. The transition comes at a critical moment for Target, as the company faces declining sales, stagnant share prices, intense competition from rivals like Amazon and Walmart, and growing investor skepticism about its growth strategy.


A Leadership Shift at a Critical Time

The appointment marks a return to Target’s tradition of promoting insiders to the top role. Brian Cornell, the outgoing CEO, was the company’s first-ever external hire and served for a decade during which Target expanded its e-commerce operations and brand reach.

However, Fiddelke’s appointment has sparked mixed reactions. While his deep knowledge of the company is seen as a strength, analysts believe investors were hoping for fresh perspectives from an external candidate, especially during this turbulent period.


Why the Change Was Needed

Target’s recent performance underscores the urgency of the leadership shakeup. In May, the company reported a 5.7% drop in quarterly sales, citing weaker consumer demand amid higher prices and uncertainty over tariffs. In addition, the company faced public backlash over its decision to scale back diversity, equity, and inclusion (DEI) targets, further straining customer sentiment.

Adding to its woes, Target’s share price dropped nearly 11% following the CEO announcement before partially recovering. Investors fear that appointing a long-time insider may not deliver the transformational change required to turn things around.


Michael Fiddelke’s Roadmap for Target

In his first statement as CEO-designate, Fiddelke emphasized the need for speed and innovation. He pledged to:

  • Improve product quality across apparel, electronics, and home goods.
  • Accelerate operations, making the company more agile in responding to consumer needs.
  • Leverage technology to enhance both in-store and digital shopping experiences.

These commitments reflect the retailer’s broader push to regain market share in an increasingly competitive retail landscape.


The Competitive Pressure from Amazon and Walmart

Target’s struggles cannot be viewed in isolation. Rivals Amazon and Walmart have aggressively expanded their product offerings, e-commerce capabilities, and pricing strategies. Walmart’s dominance in groceries and Amazon’s seamless online experience have left Target squeezed in the middle.

While Target remains a popular choice for affordable clothing, homeware, toys, and groceries, its value proposition has weakened in recent years. Without clear differentiation, the retailer risks losing ground in its most profitable categories.


Investor Concerns and Market Reactions

Market experts have expressed doubts about Fiddelke’s appointment.

  • Susannah Streeter, head of money and markets at Hargreaves Lansdown, noted that the move “may underwhelm investors,” pointing out that a high-profile external hire could have brought “extra knowledge, insight, and energy.”
  • Michael Baker, an analyst at DA Davidson, said the leadership change “lacks the pop” that could have energized markets.

Such reactions highlight a broader concern that Target may be playing it safe at a time when bold moves are required.


Looking Ahead: Can Target Rebuild Momentum?

The road ahead for Target will not be easy. The company must navigate:

  • Sluggish consumer spending amid inflationary pressures.
  • Tariff uncertainties, which continue to impact pricing and supply chains.
  • Brand reputation issues, including lingering fallout from past controversies.
  • Stiff competition, especially in e-commerce and grocery segments.

Fiddelke’s leadership will be tested by how quickly Target can adapt to changing market dynamics. Success will depend on whether he can deliver tangible improvements in product quality, digital transformation, and customer experience.


Conclusion

Target’s decision to promote Michael Fiddelke to CEO signals a bet on continuity at a time when disruption may be necessary. With sales down, competition intensifying, and investors unconvinced, the new chief executive faces a daunting challenge: to reignite growth and restore investor confidence.

While skepticism remains high, Fiddelke’s deep company knowledge and focus on speed and technology could provide the tools needed to steer Target back on track. The coming months will reveal whether Target’s choice of an insider will pay off—or if investors were right to hope for outside innovation.

TOP 50 CRYPTO COINS

Bitcoin Drops Below $114,000: Is a Deeper Correction Coming for Crypto Investors?

17

Introduction

Bitcoin, the world’s largest cryptocurrency, witnessed a sharp decline on Tuesday, falling below the $114,000 mark for the first time in weeks. The sell-off, which accelerated after BTC broke a critical support at $116,600, has raised concerns of a deeper correction in the coming sessions. With volumes spiking on red candles and global markets showing signs of weakness, traders are left wondering whether Bitcoin can defend its lower supports or if more pain lies ahead.


Bitcoin Breaks Support as Bears Take Control

Bitcoin’s recent price action has tilted in favor of bears after several days of indecision. The cryptocurrency had been consolidating between $116,500 and $120,000 but finally broke to the downside, triggering aggressive selling pressure.

The technical chart paints a bearish picture. The 20-day simple moving average (SMA) at $116,624, which had been a support level for the past two weeks, was broken decisively. Adding to the bearish momentum, the daily candle closed near its low at $113,291, leaving little sign of a buying defense.

The current breakdown also aligns with increasing trading volumes, signaling that sellers are in firm control. For short-term traders, this move below $114,000 highlights the potential for further downside toward the lower Bollinger Band near $111,500.

“Bitcoin plunges below $114,000 after breaking key support levels.”


In addition to technical indicators, market psychology is playing a role. The $120,000 mark had been a strong resistance for BTC, rejected multiple times in the past month. Failure to break that barrier created frustration among bulls, and once the price slipped below moving averages, stop-loss triggers added to the selling cascade.

Institutional investors, who often watch technical signals closely, may also reduce exposure in the near term. This could amplify pressure on BTC, especially if macroeconomic conditions continue to favor risk-off sentiment.


Macroeconomic Pressures Weighing on Crypto

Bitcoin’s fall is not happening in isolation. Broader market dynamics, including global equity weakness and rising U.S. Treasury yields, are weighing on risk assets. Investors are increasingly cautious as the Federal Reserve signals its intent to maintain tight monetary policy until inflation is firmly under control.

Cryptocurrencies, often seen as high-risk, high-reward assets, tend to suffer when borrowing costs rise and liquidity tightens. The current environment mirrors earlier cycles when Bitcoin corrected sharply during periods of aggressive rate hikes.

Geopolitical risks have also played a role. Ongoing trade disputes, uncertainty in European markets, and concerns over China’s economic slowdown have created a risk-off environment. Investors seeking safety have turned to bonds, gold, and the U.S. dollar, leaving cryptocurrencies vulnerable to selling pressure.

Another factor is the recent performance of altcoins. While Bitcoin dominates the market, weakness across Ethereum, Solana, and other leading tokens has contributed to the overall bearish momentum. Traders often reduce exposure across the board when Bitcoin fails to hold support, creating a snowball effect.


Investor Sentiment: Fear Creeping Back Into the Market

One of the clearest indicators of investor sentiment is the Fear & Greed Index, which has shifted from neutral to fear levels in recent days. Social media discussions also reflect rising anxiety, with traders debating whether Bitcoin has entered a deeper correction phase.

The crypto community, however, remains divided. Long-term holders, often referred to as “HODLers,” continue to argue that short-term volatility should be ignored in favor of Bitcoin’s long-term potential. On the other hand, short-term traders see the breakdown as a warning sign, advising caution until the market finds a stable base.

Analysts warn that if BTC fails to hold $111,000, the next support lies near $108,000—a level not tested in months. Breaking this range could shift the market narrative from consolidation to bearish trend continuation.


Technical Outlook: Key Levels to Watch

Looking ahead, Bitcoin faces a classic make-or-break scenario. On the upside, the $116,600–$117,000 zone now acts as immediate resistance. A sustained move above this level could spark short-covering rallies, pushing BTC back toward $118,000–$120,000. However, the burden of proof lies with the bulls.

On the downside, immediate support lies near $111,500, with the psychological $111,000 mark seen as critical. If this zone holds, Bitcoin could remain range-bound between $111,000 and $120,000. But if sellers push below $111,000, a sharper correction toward $108,000 or even $105,000 cannot be ruled out.

Volume analysis further supports the bearish case. Increasing sell volumes on red candles compared to declining buy volumes on green days reflect an imbalance in market momentum. Unless this trend reverses, BTC may continue to drift lower in the short term.


Global Perspective: How Other Markets Are Reacting

Global financial markets are showing a similar risk-off tone. U.S. equity indices like the Dow Jones and S&P 500 are struggling with resistance levels, while European markets are under pressure due to energy and inflation concerns. Asian markets, particularly in China and Japan, are also facing headwinds, creating an environment of uncertainty.

For Bitcoin, this correlation matters. Historically, BTC has shown tendencies to move in line with equities during risk-off phases, even though it is often marketed as a “digital gold” safe-haven asset. The current decline suggests that investors are treating it more like a risk asset, selling it alongside stocks.

Meanwhile, institutional adoption remains a long-term positive story but has done little to shield Bitcoin from short-term volatility. ETFs, derivatives, and corporate treasuries holding BTC have added legitimacy, but market cycles continue to dictate short-term behavior.


Outlook: Can Bitcoin Rebound or Will the Slide Continue?

The outlook for Bitcoin depends on whether buyers step in to defend key supports in the coming days. If BTC holds above $111,000 and reclaims $116,600, it could signal a stabilization phase, offering traders an opportunity for a rebound. In that case, a retest of $120,000 may be back on the table.

However, if bearish momentum continues and $111,000 breaks decisively, the market may see panic-driven selling. This could drag Bitcoin down toward $108,000 or even lower, testing the patience of long-term investors.

In conclusion, Bitcoin’s latest drop below $114,000 reflects a combination of technical breakdowns and macroeconomic pressures. The next few sessions will be critical in determining whether the market stabilizes or extends its decline. For now, traders are advised to stay cautious, monitor key levels, and manage risk carefully.


Disclaimer

This article is intended for informational purposes only and does not constitute financial advice. Cryptocurrency investments are highly volatile and carry significant risk. Investors should conduct their own research or consult a licensed financial advisor before making decisions.

Top 50 Crypto Coins

Dow Jones Faces Resistance at 45,000: Is a Breakout or Pullback Ahead?

19

Introduction

The Dow Jones Industrial Average (DJIA) is hovering near a crucial resistance level of 45,000, sparking debates among traders and investors about whether the index will break higher or face a pullback. Despite recent bullish momentum, market sentiment remains cautious as global economic uncertainties, corporate earnings, and Federal Reserve policies continue to weigh on investor decisions. With technical indicators flashing mixed signals, the Dow’s next move could set the tone for U.S. equities heading into the final weeks of August 2025.


Dow Jones at a Crossroads: Resistance Meets Investor Caution

The Dow Jones has been trading in a tight range, with the 45,000 mark acting as a psychological and technical resistance. After climbing steadily in recent sessions, the index now faces selling pressure as traders lock in profits at higher levels. The latest candlestick patterns reflect indecision in the market, with intraday volatility suggesting a battle between bulls and bears.

This resistance point is significant not only because of its round-number appeal but also due to its proximity to the upper Bollinger Band and historical rejection levels. Technical analysts believe that if the index can close above 45,100 with strong volume, it may trigger a breakout rally toward 45,400–45,600. On the downside, failure to sustain above current levels could invite selling, dragging the index back to 44,500 or even lower.

“Dow Jones facing key resistance near the 45,000 mark.”


The broader market sentiment reflects a mix of optimism and caution. Bulls are encouraged by recent earnings beats from large-cap companies and signs of economic resilience in the U.S. labor market. However, bears highlight concerns such as sticky inflation, geopolitical tensions, and slowing global growth. Analysts warn that the Dow is at an inflection point where fundamentals and technicals must align to dictate the next trend.

For retail traders, intraday signals suggest that volatility could provide opportunities on both long and short sides. A sustained push above 45,000 may encourage breakout buyers, while a dip below 44,800 could favor short-sellers targeting 44,500 support. Institutional investors, meanwhile, are watching macroeconomic cues like the Federal Reserve’s next interest rate move, which could directly influence equity valuations.


Economic Indicators Adding Pressure to Equities

While the Dow Jones is wrestling with resistance, external economic indicators are playing a pivotal role in shaping sentiment. Inflation data remains a central theme, with the latest Consumer Price Index (CPI) figures showing inflation moderating but still above the Fed’s 2% target. This has kept monetary policy in focus, as investors weigh the likelihood of another rate hike before year-end.

Higher interest rates typically pressure equity markets by raising borrowing costs and reducing corporate profitability. However, the resilience of the U.S. economy, particularly strong consumer spending and job growth, has provided a cushion against downside risks. Treasury yields have also eased slightly, giving equities some breathing space.

Corporate earnings have been another driver. Tech giants and industrial heavyweights have reported better-than-expected results, which has supported the Dow’s recent recovery. However, weaker performance from financials and energy companies has kept gains in check. This uneven earnings trend underscores the importance of sector rotation in determining the index’s trajectory.

Investors are also tracking geopolitical developments, including ongoing trade tensions with China and instability in Europe. Any escalation in these areas could trigger risk-off sentiment, pushing funds into safe-haven assets like gold and bonds, potentially weighing on equities.


Global Markets and Investor Sentiment: A Broader Perspective

Global equity markets have mirrored the Dow’s cautious stance. European indices like the DAX and FTSE have struggled with inflation concerns and slowing growth, while Asian markets have been pressured by China’s weaker-than-expected recovery. The interconnected nature of global financial systems means that shocks in one region can ripple through to others, influencing U.S. indices like the Dow.

Despite headwinds, investor sentiment has not turned outright bearish. The VIX, Wall Street’s “fear gauge,” remains relatively subdued, suggesting that volatility expectations are not extreme. Market strategists argue that investors are in a wait-and-see mode, closely monitoring upcoming macroeconomic releases, including the Fed’s minutes and key employment data.

For traders, this environment calls for agility. Swing traders may find opportunities in exploiting the Dow’s sideways movements, while long-term investors may prefer to stay invested, betting on eventual resilience. The presence of strong institutional support near 44,500 suggests that significant downside risks could be contained unless macroeconomic conditions deteriorate further.


Outlook: What Lies Ahead for the Dow Jones?

Looking forward, the Dow Jones is expected to remain range-bound unless a clear breakout or breakdown emerges. A close above 45,100 could ignite bullish momentum, drawing fresh capital into equities. This scenario may align with a dovish shift from the Federal Reserve or continued strong earnings. On the other hand, a sustained rejection near resistance could lead to a pullback, testing 44,500 and possibly 44,000 in the near term.

Market experts emphasize that August and September are historically volatile months for equities, often shaped by thin trading volumes and heightened macroeconomic uncertainties. Traders should prepare for sharp intraday swings and use disciplined risk management strategies.

In conclusion, the Dow’s struggle at the 45,000 mark represents a critical juncture for both short-term traders and long-term investors. With economic data, Fed policy, and global events all in play, the index’s next move could define market sentiment heading into the final quarter of 2025. Whether it breaks out to new highs or consolidates further, the Dow’s path will be closely watched by investors worldwide.


Disclaimer

This article is for informational purposes only and should not be considered financial advice. Investors are advised to conduct their own research or consult with a licensed financial advisor before making investment decisions.

Top 50 Crypto Coins

Dow Jones Intraday Analysis: Is the Market Preparing for a Sharp Move?

17

Introduction

The Dow Jones Industrial Average (DJIA) remains one of the most closely watched stock indices in the world, acting as a pulse-check on U.S. market sentiment. On August 18, 2025, the Dow showed mixed signals, with intraday candles hinting at possible short-term weakness but maintaining a broader upward structure. Traders are now asking: Is this just a temporary pullback or the start of a bigger correction?

In this article, we’ll explore the background of recent Dow trends, analyze the latest intraday developments, dive deep into technical indicators such as Bollinger Bands, moving averages, and resistance levels, and provide expert insights and possible scenarios for the coming sessions.


Why the Dow Jones Is at a Critical Turning Point

Over the last few months, the Dow Jones has been navigating through a volatile environment shaped by interest rate expectations, corporate earnings, and geopolitical risks. Historically, August tends to bring higher volatility due to lower summer trading volumes and rebalancing activity by large funds.

In 2023–2024, the Dow demonstrated resilience by recovering from banking-sector stress and inflation-driven sell-offs. Entering mid-2025, the index has remained on an upward trajectory, but intraday swings highlight how sensitive markets are to both macro data and technical resistance zones.

The current chart shows price action consolidating near 45,000 points, a psychologically important level. Historically, such round numbers often act as both resistance and support, attracting heavy institutional activity. Whether the Dow breaks out above 45,100 or slips below 44,700 could define its short-term direction.


Data & Statistics

  • Current Price (Aug 18, 2025): 44,875.99
  • Intraday High: 44,477.32
  • Intraday Low: 44,333.30
  • Resistance Levels: 45,080 – 45,100 zone
  • Support Levels: 44,406 (20-SMA), 44,699 (Bollinger Band midline)
  • Volatility: Bollinger Bands widening slightly, signaling increased short-term swings


Dow Jones price chart showing resistance levels in August 2025.


Current Developments: A Tense Trading Session

The intraday candlesticks reveal an early attempt to push higher, which was rejected around 45,080, leading to a sequence of red candles. This indicates profit-taking near the resistance zone. Market participants are watching closely because the Dow has been hovering near recent highs, but momentum seems to be weakening.

Several factors are influencing sentiment:

  • U.S. Federal Reserve outlook: Traders are split on whether another rate hike will arrive before year-end.
  • Corporate earnings season: Mixed results from industrial and tech-heavyweights are creating uncertainty.
  • Global macro risks: Oil price fluctuations and ongoing trade discussions continue to affect investor psychology.

Social media chatter also reflects cautious optimism. Some analysts argue that the pullback is just a healthy pause before another leg higher, while others warn that a break below 44,700 could trigger a deeper retracement.


Technical & Fundamental Analysis

From a technical perspective, the Dow Jones shows the following key patterns:

  1. Bollinger Bands:
    • The price is currently near the mid-band (44,699).
    • The upper band at 45,080 acted as resistance, and the failure to break above it suggests consolidation.
    • If the Dow holds above the middle band, bulls still have control.
  2. Moving Averages:
    • The 20-SMA (44,406) is acting as immediate short-term support.
    • The 50-SMA lies further below near 44,100, providing a secondary safety net.
    • Price remains above these averages, signaling that the broader trend is still bullish.
  3. Volume Action:
    • A sharp red candle on high volume indicates selling pressure near the 45,100 zone.
    • Follow-through selling will be critical to confirm a bearish shift.
  4. Momentum Indicators (RSI, MACD — not shown but inferred):
    • RSI likely cooling from overbought levels, hinting at short-term consolidation.
    • MACD histogram expected to flatten, reflecting slowing momentum.

Risks and Challenges

  • Breakdown Risk: A close below 44,400 could open the door to 44,000 and possibly 43,800.
  • Macro Uncertainty: Upcoming Fed speeches may trigger sharp intraday volatility.
  • False Breakouts: Given thin summer liquidity, price whipsaws around resistance zones are possible.

Expert Opinions & Market Sentiment

Market analysts remain divided:

  • Ed Yardeni (Yardeni Research) recently noted that U.S. indices remain “in a broad uptrend, but overextended in the short term,” advising traders to stay cautious near resistance zones. [Source: CNBC]
  • Mohamed El-Erian highlighted that while U.S. equities have been strong, “bond market signals are flashing caution,” suggesting investors should brace for volatility. [Source: Bloomberg]
  • On social media platforms like X (formerly Twitter), traders widely mention 45,100 as the critical breakout zone — if it holds, momentum could return quickly.

This mixed sentiment underscores the fragile balance between optimism and caution.


Future Outlook / Predictions

Looking ahead, three scenarios seem most likely:

  1. Bullish Case (Breakout Above 45,100)
    • Dow breaks resistance and heads towards 45,400–45,500.
    • Triggered by strong earnings or dovish Fed comments.
  2. Bearish Case (Breakdown Below 44,400)
    • Increased selling pushes Dow towards 44,000–43,800.
    • Triggered by higher bond yields or geopolitical tensions.
  3. Neutral / Sideways Case (Range-Bound 44,500–45,100)
    • Consolidation continues with choppy intraday action.
    • Traders rotate into selective sectors, keeping the index in check.

Given the current chart setup, the neutral-to-bullish scenario appears slightly more probable unless external shocks drive panic selling.


Conclusion & Call-to-Action

The Dow Jones Industrial Average is at a make-or-break juncture. While the medium-term trend remains bullish, short-term candles highlight profit-taking near key resistance. Traders should keep an eye on 44,700 as support and 45,100 as resistance. A breakout or breakdown will likely dictate the next 500-point move.

If you found this analysis useful, consider sharing it with fellow traders and leaving your comments below. For deeper insights, you may also read our detailed posts on:


Disclaimer

This article is for informational purposes only and should not be taken as financial advice. Always consult a registered financial advisor before making investment decisions.

Bitcoin Price Set for a Breakout? Key Technical Levels Traders Must Watch in 2025

9

Introduction

Is Bitcoin preparing for its next big breakout? With the cryptocurrency market showing heightened volatility in August 2025, traders and long-term investors are closely watching Bitcoin’s price action. The world’s largest digital asset has been consolidating near the $118,000 mark, but recent chart patterns suggest a potential move in either direction.

In this article, we will break down Bitcoin’s historical context, analyze current developments, review technical indicators, and explore market sentiment. We’ll also highlight risks and challenges while presenting possible scenarios for Bitcoin’s future price movement. Whether you are a day trader, long-term investor, or simply crypto-curious, this analysis will give you actionable insights.


Why Bitcoin Is at a Critical Turning Point

Over the years, Bitcoin has experienced multiple boom-and-bust cycles, but 2025 is proving to be a decisive year. After its remarkable rally in late 2024, Bitcoin touched levels above $123,000 before retracing. This retracement is not unusual—it reflects a healthy correction phase that often precedes the next big rally.

Historically, Bitcoin tends to consolidate before major breakouts. Analysts note that consolidation phases near strong support levels often build momentum for upward moves. The $116,000 zone has emerged as a key support, while $120,000 remains the immediate resistance.

Trusted sources like CoinTelegraph and Investopedia highlight Bitcoin’s unique resilience despite regulatory pressures and macroeconomic uncertainty. As inflation concerns linger globally, Bitcoin’s narrative as “digital gold” continues to attract institutional and retail investors alike.


Data & Statistics

  • Current Price: $118,235 (as of August 2025)
  • 24h Range: $117,266 – $118,626
  • Key Support Levels: $116,971, $111,997
  • Key Resistance Levels: $120,091, $121,946
  • Volume (24h): 463 BTC

Bitcoin price chart showing resistance levels in August 2025.


Current Developments / News

Bitcoin’s recent pullback from $123,000 has caught the attention of analysts. Social media discussions point to strong buying pressure near the $117,000 level, suggesting institutional investors may be quietly accumulating. On-chain data also reveals an uptick in wallet addresses holding significant Bitcoin balances, which could indicate confidence in long-term growth.

Meanwhile, global events continue to impact Bitcoin sentiment. Reports from major financial institutions suggest that Bitcoin ETFs have seen increased inflows, providing additional legitimacy to the asset class. On X (formerly Twitter), crypto influencers are calling this phase a “calm before the storm,” hinting at an upcoming price surge.

For traders, the focus remains on whether Bitcoin can reclaim and hold above $120,000. A daily close above this level could ignite bullish momentum, while failure to hold could lead to deeper corrections.


Technical and Fundamental Analysis

From a technical perspective, Bitcoin is currently trading just above its 20-day Simple Moving Average (SMA) of $116,971. This level acts as a strong support zone. The Bollinger Bands suggest volatility is compressing, which typically precedes a breakout. If the price breaches $120,000 with strong volume, the next target could be $125,000.

On the downside, if Bitcoin fails to defend $116,000, we may see a retest of the $112,000 level. Traders are also keeping an eye on the Relative Strength Index (RSI), which hovers near neutral territory, giving room for both bullish and bearish moves.

Fundamentally, Bitcoin continues to benefit from increasing adoption. With institutional players adding Bitcoin to their portfolios and countries exploring Bitcoin-friendly regulations, the long-term trajectory remains bullish. However, macroeconomic uncertainties, including central bank policies, could create headwinds.


Risks and Challenges

  • Regulatory Pressure: Governments worldwide may tighten crypto regulations.
  • Market Volatility: Sudden price swings could liquidate leveraged traders.
  • Macroeconomic Uncertainty: Rising interest rates or recession fears could affect demand.
  • Technical Failures: If Bitcoin breaks below $112,000, bearish sentiment may dominate.

Expert Opinions & Market Sentiment

Leading analysts have shared their perspectives on Bitcoin’s current phase:

  • Michael Saylor (MicroStrategy) recently stated that Bitcoin remains the “best-performing asset of the decade,” suggesting that dips should be viewed as buying opportunities.
  • Analysts from JPMorgan highlighted in their recent report that Bitcoin could act as a hedge against inflation if current macroeconomic pressures persist.
  • Crypto research firm Glassnode noted that long-term holders are accumulating, a historically bullish sign.

Market sentiment remains cautiously optimistic. While short-term traders expect volatility, the broader consensus leans toward Bitcoin eventually breaking higher.


Future Outlook / Predictions

Looking ahead, Bitcoin’s trajectory depends on key breakout levels:

  • Bullish Scenario: If Bitcoin closes above $120,000 and sustains momentum, it could rally toward $125,000–$130,000 in the coming weeks.
  • Bearish Scenario: Failure to hold $116,000 could push Bitcoin down to $112,000 or lower.
  • Neutral Scenario: Bitcoin continues to consolidate between $116,000–$120,000, building momentum for a larger move later in 2025.

Long-term investors remain optimistic, but traders must prepare for volatility as Bitcoin nears critical levels.


Conclusion & Call-to-Action

Bitcoin stands at a pivotal moment in August 2025. With $116,000 as strong support and $120,000 as immediate resistance, traders and investors should closely monitor price action. While risks remain, expert sentiment and on-chain data point toward long-term bullishness.

What do you think—will Bitcoin break past $120,000 or fall back toward $112,000? Share your views in the comments below and check out our related analysis on Ethereum and broader crypto market trends.


Disclaimer: This article is for informational purposes only and should not be taken as financial advice. Always do your own research before making investment decisions.


Oracle Layoffs Hit Cloud Unit Amid AI Investment Surge — What It Means for the Company’s Future

Dow Jones Technical Analysis August 2025: Key Levels, Market Sentiment, and What Traders Should Watch

14

Introduction

The Dow Jones Industrial Average (DJIA) has been on a rollercoaster ride this August, with volatility returning to the U.S. equity markets. After a series of steady gains, the index recently touched the 45,200 mark before pulling back sharply, raising questions about whether this is a short-term correction or the start of a deeper pullback.
In this in-depth article, we’ll break down the latest market developments, examine technical levels from the current chart, review expert opinions, and outline possible bullish, bearish, and neutral scenarios for the Dow in the coming weeks.


Why the Dow Jones Is at a Critical Turning Point

The DJIA is often seen as a bellwether for the broader U.S. economy, tracking 30 blue-chip stocks from sectors ranging from technology to industrials. Historically, August has been a month of increased volatility, often due to lower trading volumes and seasonal patterns.
Over the past decade, August has produced several notable moves:

  • In 2015, the Dow dropped over 1,000 points in a single session due to concerns about China’s economy.
  • In 2020, the index surged as stimulus optimism grew amid the pandemic.
  • In 2022, the Dow retraced sharply after hawkish comments from the Federal Reserve.

Now in 2025, the index is testing multi-month resistance while facing macroeconomic uncertainty, including corporate earnings pressure and shifting interest rate expectations.
These conditions make the current setup one of the most closely watched by traders and long-term investors alike.


Data & Statistics

Recent performance highlights for the DJIA:

  • Current Price: 45,032 (as of August 15, 2025 close)
  • Monthly Range: 44,100 – 45,200
  • 20-Day SMA: 44,848 (acting as dynamic support)
  • Bollinger Bands: Upper band at 45,016, lower band at 44,681
  • Volatility: Average True Range (ATR) suggesting ~200–250 point intraday swings
DateOpenHighLowCloseChange %
Aug 13, 2544,78045,05044,72045,010+0.52%
Aug 14, 2545,01045,18044,93045,160+0.33%
Aug 15, 2545,04845,20045,00245,032-0.03%


Dow Jones chart showing resistance levels and recent rejection in August 2025.


Current Developments / News

Over the past week, the Dow has rallied from sub-44,500 levels, breaking a short-term downtrend line before stalling near the 45,200 resistance zone. This move coincided with mixed U.S. economic data:

  • Retail Sales: Slightly weaker than expected, raising hopes for a Fed pause.
  • Corporate Earnings: Several Dow components reported cautious guidance for Q4.
  • Jobless Claims: Rose modestly, hinting at a cooling labor market.

Market chatter has been divided. On social media platform X (formerly Twitter), some traders see the latest rejection as a classic “bull trap,” while others argue it’s simply profit-taking before another leg higher.
CNBC quoted a senior strategist from Bank of America saying, “We’re approaching an inflection point. The Dow’s ability to hold above 44,850 will be crucial for the next two weeks.”


Technical Analysis

Looking at the 30-minute Dow chart you provided:

  • Resistance Zone: 45,076–45,200 — price rejected sharply from this level.
  • Support Zone: First support at 44,850 (20 SMA), second support at 44,680 (lower Bollinger Band).
  • Breakout/Breakdown Points: A close above 45,200 could trigger a rally toward 45,400–45,500, while a break below 44,680 risks a drop toward 44,400.
  • Bollinger Bands: Currently widened, suggesting elevated volatility.
  • Trendline Break: The downtrend from August 7 was broken on August 12, giving way to a short-term uptrend.
  • Volume: Spike on the red candle at resistance — potential sign of institutional selling.

From a day trader’s perspective:

  • Bearish Intraday Setup: Short below 45,000 with targets at 44,850 and 44,680; stop-loss above 45,100.
  • Bullish Intraday Setup: Long above 45,200 with targets at 45,400 and 45,500; stop-loss at 45,080.

Risks and Challenges

  • Macro Uncertainty: Any hawkish Fed commentary could trigger a sell-off.
  • Thin Summer Liquidity: August’s low volumes can lead to exaggerated moves.
  • False Breakouts: The proximity to resistance increases the risk of bull traps.
  • Geopolitical Risks: Headlines around trade tensions or global events could impact sentiment.

Expert Opinions & Market Sentiment

Market sentiment is currently mixed:

  • Bullish View: Goldman Sachs analysts see potential for the Dow to push toward 46,000 by September if earnings remain resilient.
  • Bearish View: Morgan Stanley warns of a “seasonal correction,” projecting a possible retest of 44,000 before year-end.
  • Neutral View: JP Morgan suggests range-bound trading between 44,500 and 45,500 until a clear catalyst emerges.

A survey by MarketWatch found 53% of retail traders are bullish on the Dow for the next month, while 47% expect sideways or bearish action.


Future Outlook / Predictions

Over the next two weeks, three scenarios are likely:

  1. Bullish Scenario:
    Price closes above 45,200 with momentum and strong volume, targeting 45,500 and possibly 46,000. This would require supportive economic data and stable global conditions.
  2. Bearish Scenario:
    Price fails to reclaim 45,100 and breaks below 44,680, triggering stops and sending the Dow toward 44,400 and potentially 44,100.
  3. Neutral Scenario:
    Consolidation between 44,850 and 45,200 as traders await Jackson Hole Symposium commentary from the Federal Reserve.

Given the current rejection at resistance, the market is at a “decision point” — traders should watch the first hour of Monday’s session for directional clues.


Conclusion & Call-to-Action

The Dow Jones Industrial Average is standing at a technical crossroads in August 2025. The battle between bullish momentum and resistance selling pressure will likely define the next major move.
For traders, respecting stop-loss levels and keeping position sizes modest is key in this high-volatility environment.
If you found this analysis helpful, share it with fellow traders and check out our latest coverage on Market technical trends and Global market News outlook for a broader market perspective.


Disclaimer: This article is for informational purposes only and does not constitute financial advice. Always do your own research or consult a licensed advisor before making investment decisions.

Oracle Layoffs Hit Cloud Unit Amid AI Investment Surge — What It Means for the Company’s Future

14

Introduction

Is Oracle quietly reshaping its future? The tech giant has begun cutting jobs in its Oracle Cloud Infrastructure (OCI) division, even as it pours billions into artificial intelligence infrastructure. In a move that caught employees off guard, layoffs began this week, targeting select roles while hiring continues in other areas.

The decision comes amid a balancing act between cost control and aggressive AI expansion — a tension faced by many big tech firms in 2025. This article breaks down the background of Oracle’s restructuring, analyzes the current developments, evaluates risks, and explores what this could mean for employees, investors, and the cloud computing market.


Why Oracle Is at a Critical Turning Point

Over the past decade, Oracle has evolved from a database powerhouse into a key player in cloud computing. OCI has been central to that shift, competing against Amazon Web Services (AWS), Microsoft Azure, and Google Cloud.

However, in recent years, the company has been trimming and reshaping its workforce.

  • In March 2025, Oracle cut an estimated 7% of its global workforce — over 11,000 employees — though it never confirmed the exact figure (Channel Futures).
  • In late 2024, several hundred employees in OCI were let go, particularly in U.S. operations, with reports suggesting that higher-paid senior staff were replaced by lower-cost hires (DataCenterDynamics).

Now, the August 2025 layoffs mark yet another step in this restructuring process — with a clear shift toward aligning resources with AI priorities.


Data & Statistics

  • Layoff Date: August 13, 2025 (Bloomberg)
  • Division Affected: Oracle Cloud Infrastructure (OCI)
  • Estimated Workforce Reduction (past year): ~7% globally
  • Past Layoff Events:
    • March 2025 — 11,000+ employees affected (unconfirmed)
    • Late 2024 — several hundred OCI staff
  • Geographic Impact: Strongly felt in India, per employee reports

“Oracle headquarters — August 2025 marks another restructuring wave in OCI.”


Current Developments / News

According to Bloomberg, Oracle initiated the latest round of layoffs within its OCI unit this week. Notifications were sent directly to affected employees, and while some terminations were linked to performance, this is part of a broader cost-control strategy.

Interestingly, the layoffs are not a sign of a hiring freeze. Sources note that OCI continues to recruit for other roles, suggesting that Oracle is not downsizing overall, but rather reshaping its talent pool to meet evolving demands — especially in AI.

Ground reports from social platforms highlight a localized impact:

  • “India teams were hit really bad… looks like it’s only OCI and mostly India.” — Reddit user
  • “2 from my team are impacted. Also at least 5 other guys whom I have seen on floor are also let go.” — Fishbowl comment

This pattern reflects Oracle’s geographical cost optimization strategy, where high-cost or less strategically aligned teams are reduced, while investments are made in AI-related operations.


Cause-and-Effect Analysis: Balancing AI and Cost Control

Oracle’s decision makes sense when viewed through the lens of resource reallocation. In 2025, cloud providers are in an arms race to supply AI infrastructure — GPUs, optimized cloud environments, and AI development platforms. This is capital-intensive, requiring billions in hardware, R&D, and specialized staff.

Cause:

  • Surging AI infrastructure investments
  • Intense competition in the cloud market
  • Need to improve efficiency and profitability

Effect:

  • Layoffs in non-core or overlapping roles
  • Strategic hiring in AI-heavy divisions
  • Potential short-term morale impact in affected teams

By trimming certain OCI functions, Oracle may be aiming to fund its AI growth without significantly increasing operational costs.


Risks and Challenges

  1. Employee Morale: Frequent layoffs risk damaging trust and productivity.
  2. Talent Drain: Losing experienced OCI engineers could slow innovation.
  3. Market Perception: Repeated cuts may raise investor questions about stability.
  4. Competitive Pressure: AWS, Azure, and Google Cloud are aggressively courting AI clients.

Expert Opinions & Market Sentiment

Industry analysts view Oracle’s move as a strategic reshuffle rather than a retreat from cloud computing.

Patrick Moorhead, CEO of Moor Insights & Strategy, noted earlier this year:

“Every major cloud provider is racing to lead in AI infrastructure. This means reallocating resources quickly — sometimes painfully — to match where the market is going.”

Market watchers believe that Oracle’s AI investments, if executed well, could make OCI a stronger competitor in specialized workloads, particularly in enterprise AI solutions.

Investor sentiment appears mixed. Some see cost-cutting as a healthy sign of discipline, while others worry that frequent layoffs might hint at deeper structural issues.


Future Outlook / Predictions

Oracle’s future in the AI-driven cloud market could play out in three scenarios:

Bullish Scenario:

  • AI investments pay off, attracting major enterprise clients
  • OCI gains market share in AI workloads
  • Revenue growth offsets any negative PR from layoffs

Bearish Scenario:

  • Talent loss hampers service quality
  • AI investments fail to deliver ROI quickly
  • Market share slips to AWS, Azure, and Google Cloud

Neutral Scenario:

  • Steady but unspectacular growth in AI services
  • OCI maintains a niche in enterprise solutions without major expansion

Given Oracle’s deep pockets and history of adapting to market shifts, the bullish or neutral outcome appears more likely — but execution will be key.


Conclusion

Oracle’s latest OCI layoffs are not just a cost-cutting measure — they’re part of a broader realignment toward AI dominance. While painful for those affected, the move signals a clear intent: focus resources where future growth is most likely.

If you’re following cloud and AI market shifts, Oracle’s strategy is worth watching. The coming quarters will reveal whether this gamble pays off.


Disclaimer: This article is for informational purposes only and should not be taken as financial advice. Readers should consult a qualified financial advisor before making investment decisions.

Title: Dow Jones Surges Past Key Resistance as Bulls Eye 45,000: Is the Uptrend Back on Track?

Bitcoin Price Set for a Breakout? Key Technical Levels Traders Must Watch in 2025

12

Introduction

Bitcoin (BTC) is once again standing at the crossroads, teasing traders with a potentially explosive breakout while keeping skeptics on their toes. Over the past few weeks, Bitcoin’s price action has been consolidating in a narrow range, indicating that a major move might be on the horizon. With macroeconomic uncertainty, increased institutional interest, and rising retail participation, market watchers are wondering — will 2025 be the year Bitcoin breaks past all-time highs, or will it face another harsh rejection?

In this article, we’ll explore why Bitcoin is currently at a critical turning point, examine the latest market data, analyze key technical levels from the August 2025 chart, share expert opinions, and consider the potential scenarios that could unfold in the months ahead.


Why Bitcoin Is at a Critical Turning Point

Bitcoin’s history is filled with sharp rallies and equally brutal corrections. Every consolidation phase in the past has been followed by a decisive move — either a strong upward trend or a prolonged downturn.

In late 2024, Bitcoin rallied close to $100,000 after a wave of institutional adoption, ETF approvals in multiple countries, and growing mainstream acceptance. However, after hitting resistance near this psychological level, BTC has been trading sideways, hovering between $92,000 and $98,000.

Historically, such prolonged consolidation near a key resistance level tends to precede significant market moves. For example:

  • In late 2020, Bitcoin hovered around $19,000 before breaking above $20,000 and starting a historic rally.
  • In early 2021, it faced resistance at $58,000 before a breakout pushed it toward $64,000.
  • In 2019, consolidation near $13,000 led to a sharp rejection and a 40% drop.

With current volatility levels at multi-month lows, traders believe the next breakout — in either direction — could be decisive.


Key Bitcoin Data & Statistics (August 2025)

  • Current Price: $121518
  • 24-Hour Volume: $38.2 billion
  • Market Cap: $1.9 trillion
  • Resistance Levels: $125000
  • Support Levels: $120,200, $116,000, $112,500
  • RSI (Daily): 58 — neutral, but leaning bullish
  • MACD (Daily): Slight bullish crossover forming
  • Volatility Index: Lowest since March 2024

“Bitcoin price chart showing resistance levels in August 2025.”


Current Developments in the Bitcoin Market

The Bitcoin market in August 2025 is being shaped by a mix of global economic events and crypto-specific developments:

  • US Federal Reserve Rate Policy: Traders are awaiting the next interest rate decision, with many expecting a slight rate cut to stimulate the economy. Historically, lower rates have been bullish for Bitcoin.
  • ETF Inflows: The Bitcoin Spot ETFs approved in the US and Europe in 2024 have seen consistent inflows, signaling strong institutional demand.
  • Mining Difficulty All-Time High: Despite the halving earlier this year, mining difficulty continues to increase, reflecting network strength.
  • Geopolitical Tensions: Bitcoin is increasingly being used as a hedge in countries facing currency instability, driving adoption in emerging markets.

Technical and Fundamental Analysis

From a technical perspective, Bitcoin’s daily chart shows a clear ascending triangle pattern — a bullish formation where price makes higher lows while repeatedly testing a horizontal resistance line. This pattern often precedes an upward breakout.

  • Resistance Zone: $98,500 is the key level. A breakout above this could trigger a rally to $102,000 and potentially $105,000.
  • Support Zone: The $94,200 area has acted as a solid floor. If this breaks, traders will look to $92,000 as the next major support.
  • RSI & MACD: The RSI at 58 suggests room for upside before hitting overbought territory, while MACD’s bullish crossover hints at momentum building.
  • Volume Trends: Breakout attempts have so far lacked volume. A true breakout will likely be accompanied by a surge in buying activity.

From a fundamental perspective, Bitcoin’s scarcity (fixed supply of 21 million coins), combined with rising global inflation fears, is creating a favorable environment for long-term holders. Institutional participation via ETFs and treasury allocations from large companies are adding credibility to Bitcoin as a macro asset.


Risks and Challenges

  • Macro Shocks: A sudden change in central bank policy or a global economic slowdown could hurt risk assets, including Bitcoin.
  • Regulatory Uncertainty: While the US and EU have embraced ETFs, other regions may impose stricter rules.
  • Liquidity Risks: Low liquidity periods could exaggerate price swings in either direction.
  • Over-Leveraging: Excessive leverage in derivatives markets could cause sharp liquidations.

Expert Opinions & Market Sentiment

Several respected analysts are weighing in on Bitcoin’s next move:

  • Michael Saylor (MicroStrategy): “Bitcoin remains the world’s premier digital asset. If we break $125,000, the next target could be $150,000 within months.”
  • Katie Stockton (Fairlead Strategies): “The technical setup is bullish, but we need a confirmed weekly close above $98,500 to validate the breakout.”
  • Arthur Hayes (BitMEX co-founder): “Volatility compression is a precursor to explosive moves. My bet is that the breakout will be upward, driven by ETF flows.”

Market sentiment indicators show a cautious optimism, with the Fear & Greed Index currently at 63 (Greed) — indicating traders are leaning bullish but aware of possible risks.


Future Outlook & Predictions

Here are three possible scenarios for Bitcoin in the next quarter:

  1. Bullish Scenario: A breakout above $125,000 attracts momentum traders, pushing BTC toward $125,000–$150,000 by year-end. ETF inflows and macro tailwinds support this move.
  2. Bearish Scenario: Rejection near $125,000 triggers a sell-off toward $104,500, shaking out over-leveraged positions before a potential recovery.
  3. Neutral Scenario: BTC continues to range between $92,000 and $100,000, frustrating traders but building a stronger base for a future rally.

Traders should watch for confirmed breakouts with strong volume before committing to positions.


Conclusion & Call-to-Action

Bitcoin is entering a make-or-break phase in 2025. Whether the price shatters the $100,000 barrier or retreats to test lower supports, the coming weeks will be pivotal for traders and long-term investors alike.

If you found this analysis helpful, share it with your trading community, bookmark it for future reference, and check our related articles on “” Dow Jones Industrial Average Rises Amid Key Support Test, Eyes Resistance Levels in August 2025 and “Top 50 Crypto Coins “


Disclaimer: This article is for informational purposes only and does not constitute financial advice. Always do your own research before making investment decisions.

Dow Jones Breaks Short-Term Downtrend, Eyes 45,000 as Bulls Regain Control

9

Introduction:
The Dow Jones Industrial Average (DJIA) closed higher at 44,741.05 on Wednesday, gaining 282.44 points (+0.64%) and signaling a potential shift in market sentiment. After weeks of sideways-to-bearish movement, the index has broken out of a short-term descending trendline, supported by strong buying momentum. With critical resistance looming near the 45,000–45,080 zone, market participants are watching closely to see if this rally will sustain and push the index toward new highs. Technical indicators and price patterns suggest that the bulls may be preparing for another run, though macroeconomic uncertainties remain a factor.


Dow Jones Breaks Out from Downtrend Channel

“Dow Jones Industrial Average daily chart showing breakout above the short-term downtrend with key resistance near 45,082.”

The DJIA’s recent price action reflects a classic technical breakout. After peaking in late July, the index entered a mild corrective phase, slipping below its 20-day moving average and testing support near 44,000 multiple times. The formation of lower highs indicated a short-term downtrend, which was finally breached in Wednesday’s session.

The Bollinger Bands, plotted around the 20-day SMA, now show the index trading above the middle band (44,385.36), a sign of regained bullish momentum. This breakout aligns with a pickup in market breadth, as more Dow components are trading above their 50-day moving averages.

Volume analysis adds weight to this move — the day’s turnover was notably higher than average, suggesting institutional participation. A clear break above 45,082.14 would open the door for a retest of the July peak and potentially higher levels. Technical analysts believe that the recent consolidation phase between 43,700 and 45,000 has built enough base for a sustained uptrend.


Expanding on the Breakout Momentum

For much of the past month, the DJIA has been consolidating in a broad horizontal range between 43,700 (support) and 45,000 (resistance). This rangebound movement followed a strong rally in May, when the index broke out of a smaller rectangular consolidation near 42,200.

The latest breakout from the downtrend channel is significant because it comes after the index held critical support at 43,688.58, which aligns with the lower Bollinger Band. Such rebounds from volatility band supports often lead to a push toward the opposite band.

From a pattern recognition standpoint, the Dow appears to be forming a “flag” breakout — a continuation pattern that typically occurs after a strong rally. If this pattern plays out, the measured move projection suggests a potential upside target of 45,800–46,000 over the next few weeks.

The Relative Strength Index (RSI) has climbed from near 44 to 57, reflecting improving momentum but still leaving room before hitting overbought levels. The MACD histogram is also showing signs of positive divergence, a bullish signal in technical analysis.

Veteran market strategist Laura McMillan noted, “The Dow has respected its major supports and is now breaking a short-term resistance. This kind of price behavior, especially with supporting indicators, points to a high-probability upside continuation if external macro shocks don’t derail sentiment.”


Key Resistance and Support Levels Ahead

For traders, the immediate level to watch is the psychological and technical resistance at 45,000–45,082. This zone has rejected price advances multiple times in the past month, making it a crucial battleground for bulls and bears.

If the index manages a strong close above this level, it could quickly move toward 45,300 and then the 45,500–45,800 range, where profit-taking may emerge. The ultimate short-term target remains 46,000, which aligns with a long-term upward channel projection.

On the downside, initial support is now seen at the 44,385.36 level (20-day SMA). A break below this would weaken the breakout narrative and could pull the index back to 44,000. Below that, the major support lies at 43,688.58 — a level that has been tested and held twice in the last two months.

Options market data also confirms the significance of the 45,000 strike, with heavy call open interest indicating strong resistance. However, analysts point out that if this level is breached, short covering could trigger a rapid upside move.


Market Sentiment and Derivative Indicators

Options positioning for the August expiry shows increased put writing at 44,500 and 44,700 levels, reflecting traders’ belief that the index will stay above these marks in the near term. The Put-Call Ratio (PCR) improved to 1.08 from 0.91 a day earlier, suggesting a tilt toward bullish sentiment.

The CBOE Volatility Index (VIX) remains subdued at around 13.4, indicating that market participants are not expecting major turbulence in the immediate term. Historically, low volatility combined with an upward breakout tends to support gradual price appreciation.

However, seasoned traders are quick to add caution. “The U.S. economic data calendar is packed over the next two weeks, and any surprise on inflation or Fed policy stance could influence sentiment dramatically,” said Jacob Turner, an equity derivatives expert.


Macro and Sector Drivers Behind the Move

Global equity markets have been mixed, but U.S. indices have benefited from resilient economic data. The latest U.S. CPI inflation reading came in slightly below expectations, easing fears of aggressive rate hikes by the Federal Reserve. This has boosted rate-sensitive sectors like real estate and financials.

Within the Dow, industrial and tech-heavy components have led the rally, supported by upbeat earnings reports. Blue-chip companies like Boeing, Apple, and Caterpillar posted results that exceeded analyst expectations, adding strength to the index.

The bond market has also provided tailwinds, with the 10-year U.S. Treasury yield easing from recent highs, making equities relatively attractive. A weaker U.S. dollar index (DXY) has further supported multinational corporations listed in the Dow, as it boosts their overseas revenue when converted back to dollars.


Outlook: Can Dow Jones Push to New Highs?

Looking ahead, the Dow’s ability to sustain momentum above 45,000 will be the decisive factor. A confirmed breakout could invite momentum traders and institutional buyers, driving the index toward its next milestone of 46,000.

Long-term investors should note that the index remains well above its 200-day moving average, keeping the primary trend bullish. Unless there is a significant deterioration in macroeconomic conditions or earnings outlook, dips are likely to be bought aggressively.

For short-term traders, 44,385 serves as the immediate pivot. As long as prices remain above this level, the risk-reward favors the long side. However, given the proximity to major resistance, partial profit booking may be prudent to lock in gains.


Disclaimer:
This article is for informational purposes only and should not be construed as financial advice. Investing in the stock market involves risks, and readers are encouraged to consult a certified financial advisor before making investment decisions.

Dow Jones Industrial Average Rises Amid Key Support Test, Eyes Resistance Levels in August 2025

Nifty 50 Breaks Downtrend as Bulls Eye 24,800 – Is a Short-Term Reversal Underway?

20

Introduction:
The Nifty 50 index staged a notable recovery on Wednesday, closing at 24,619.35 with a gain of 131.95 points (+0.54%). This upward move comes after a prolonged correction phase that saw the index slipping from its record highs above 25,600. Technical indicators now suggest a potential short-term trend reversal as Nifty breaks out of its recent downtrend channel and holds above key support levels. Traders and investors are closely watching the 24,780–24,800 zone, which could determine the index’s next directional move.


Nifty 50 Attempts Trend Reversal After Downtrend Breakout

“Nifty 50 daily chart showing breakout from a short-term downtrend with support near 24,456 and resistance at 24,782.”

The Nifty 50 index has been under sustained selling pressure for several weeks, forming a descending channel from its July highs. The downtrend accelerated in early August, pushing prices toward the lower Bollinger Band near 24,300. However, today’s session marked a crucial development as Nifty broke above the descending trendline resistance, suggesting that selling momentum might be waning.

Volume patterns add weight to this move. The day’s turnover crossed 236 million, reflecting increased buying interest after a long bearish stretch. The 20-day Bollinger Band midline at 24,781.95 is now the immediate resistance level to watch. If the index sustains above this zone, short covering could fuel further gains toward 25,250, where the upper resistance lies.

According to market analysts, a daily close above 24,800 could signal the start of a fresh bullish leg, while a fall back below 24,450 may negate the breakout and invite renewed selling. “This breakout needs confirmation with follow-up buying. The market has been jittery due to global macro concerns, but the underlying structure shows resilience,” said a senior technical strategist at a Mumbai-based brokerage.


Expanding on the Trend Reversal Attempt

Over the last month, the Nifty 50 has been influenced by a combination of domestic and international factors. Weak global cues from the U.S. and Asian markets, coupled with foreign institutional investor (FII) selling, dragged the index lower. The rise in U.S. bond yields and concerns over China’s economic slowdown also pressured sentiment.

From a technical standpoint, the breakdown below 25,000 in late July triggered panic selling, and the index tested 24,300 support last week. Interestingly, the support at 24,317.20 — aligning with the lower Bollinger Band — held firm, prompting a relief rally. Bollinger Bands are now showing a potential narrowing pattern, often a precursor to a sharp directional move.

The Relative Strength Index (RSI) has recovered from the oversold territory near 35 to around 46, indicating improving momentum but still not fully in bullish territory. Traders may also note that the candlestick formed today is a bullish engulfing pattern, which, in the right context, often signals trend reversal.

Historically, when Nifty has broken above a short-term downtrend with strong volume, follow-up rallies of 3–5% have been common, provided there’s no major macroeconomic shock. This makes the next two sessions critical for confirmation.


Key Support and Resistance Levels to Watch

The market’s near-term path will largely depend on how Nifty behaves around critical price points. On the downside, the immediate support is placed at 24,456.10 — a horizontal level tested multiple times during the correction. A decisive break below this could pull the index back to 24,317, and further down to the major psychological mark of 24,000.

On the upside, resistance is seen at 24,781.95, which coincides with the 20-day Bollinger Band middle line. A successful breach could take Nifty toward 25,246.69, where selling pressure may re-emerge. Above that, the all-time high zone of 25,641.40 remains the ultimate target for the bulls in the short term.

F&O data also suggests that traders have built fresh call positions at the 24,800 and 25,000 strikes, indicating that the market expects a consolidation-to-upside scenario rather than a deep correction. “We are witnessing short covering at lower levels. If the global market tone improves, Nifty can quickly retest 25,000 levels,” said an equity derivatives expert from a leading brokerage firm.


Derivative Signals Indicate Short Covering

Options data for the August expiry show significant call writing unwinding at the 24,500 strike and fresh put writing at the 24,400 and 24,500 strikes. This shift suggests that market participants are increasingly confident about the index holding above its recent lows.

Put-Call Ratio (PCR) for the day stood at 1.12, up from 0.94 in the previous session, signaling bullish sentiment among traders. Volatility Index (India VIX) cooled off to 12.45, indicating reduced fear in the market. Historically, such low volatility readings, when accompanied by a breakout, often precede a gradual uptrend.

However, seasoned traders caution against getting overly optimistic too soon. “While the breakout is encouraging, one should watch for a follow-up move. The macro environment remains uncertain, with crude oil prices volatile and the U.S. Fed minutes due later this week,” remarked a technical analyst.


Global and Domestic Factors Influencing Nifty’s Next Move

Nifty’s current movement cannot be viewed in isolation from broader macroeconomic cues. Global markets have been mixed, with Wall Street indices recovering slightly after recent losses. Asian peers like Nikkei and Hang Seng have shown strength in the last two sessions, providing some positive spillover to Indian equities.

On the domestic front, inflation numbers for July came in slightly above expectations at 5.15%, sparking concerns about RBI’s rate stance. However, industrial production data showed resilience, with the manufacturing sector posting robust growth. This mixed bag of economic data has kept traders cautious.

Corporate earnings season is also influencing stock-specific movements. IT majors have posted better-than-expected results, providing a cushion to the index. Banking stocks, however, remain under pressure due to rising concerns about loan growth moderation in the coming quarters.

Foreign Institutional Investors (FIIs) have been net sellers in August so far, withdrawing nearly ₹8,500 crore from Indian equities. Domestic Institutional Investors (DIIs), on the other hand, have stepped up buying, preventing a deeper fall in Nifty.


Outlook: Can Nifty Sustain the Breakout?

The short-term outlook for Nifty hinges on whether today’s breakout sees follow-through buying. A close above 24,800 with healthy volumes would strengthen the bullish case, potentially leading to a retest of 25,250–25,300 levels in the coming sessions.

For positional traders, risk management remains key. The 24,450 level should be treated as a stop-loss for long positions, while profit booking can be considered near 25,250. Swing traders may also find opportunities in sectors like IT, FMCG, and select auto stocks, which are showing early signs of relative strength.

Long-term investors might view this phase as a consolidation within a broader uptrend, given that the index remains well above its 200-day moving average. Unless global shocks derail sentiment, the Nifty’s long-term bullish structure remains intact.


Disclaimer:
This article is for informational purposes only and does not constitute financial advice. Market investments are subject to risks, and readers are advised to consult a certified financial advisor before making trading or investment decisions.

XRP Price Eyes Breakout as Bulls Challenge Descending Trendline Resistance

XRP Price Eyes Breakout as Bulls Challenge Descending Trendline Resistance

9

Introduction:
XRP is making headlines once again as it tests a critical descending trendline after bouncing strongly from support near $3.06. The cryptocurrency, which has been trading in a narrowing range over the past few weeks, is showing renewed bullish momentum. Traders are now watching closely for a breakout that could signal the start of a larger rally. With key support levels holding and buying volume increasing, the next few days could be decisive for XRP’s short-term trend.


Buyers Regain Control After Support Rebound

XRP/USD has staged an impressive recovery after finding solid footing around $3.06 — a level that coincides with both the mid-Bollinger Band and a horizontal price floor tested multiple times since late July. This rebound comes after a period of consolidation marked by lower highs and compressed volatility.

The current technical setup shows XRP pushing toward a descending trendline that has capped price rallies since late July. Breaking above this barrier could trigger a wave of fresh buying, especially from traders waiting for confirmation of trend reversal.

Market data from Bitstamp shows that XRP’s daily trading volume reached 8.56 million tokens in the latest session, reflecting growing participation. Additionally, the Relative Strength Index (RSI) has climbed steadily from oversold conditions, reinforcing the bullish sentiment. This combination of strong support, rising momentum, and trendline pressure suggests that XRP is approaching a pivotal point that could shape its price action in the weeks ahead.


XRP/USD daily chart showing rebound from $3.06 support and approach to descending trendline resistance.


Buyers Build Momentum Ahead of Resistance

XRP’s recent price action offers important clues about market psychology. The sharp rejection of sub-$3.06 prices earlier this month indicates that buyers are defending this level aggressively. Multiple tests of the support zone failed to produce a sustained breakdown, showing that selling pressure is weakening.

On the upside, the immediate challenge lies at the descending trendline currently hovering near $3.28–$3.30. A breakout above this level would likely attract momentum traders and could see XRP rally toward the upper Bollinger Band around $3.37, followed by the psychological $3.50 level.

Historically, XRP has shown that once it breaks through key resistance levels with strong volume, it can deliver swift gains. For instance, in early July, a similar setup led to a rally exceeding 25% in just over a week. Market participants are watching for a repeat, although broader market conditions — including Bitcoin’s performance — will also play a role.

A senior crypto market analyst, John Mercer of Digital Asset Insights, commented:

“XRP’s technicals are aligning for a potential breakout, but traders should keep an eye on volume. Without a surge in participation, price may struggle to sustain gains beyond initial resistance zones.”


Consolidation Pattern Points to Imminent Volatility

XRP’s chart structure over the past month reveals a classic descending triangle formation — often seen as a continuation pattern, but in the current context, it could serve as a springboard for a bullish reversal. The narrowing range between lower highs and flat support has compressed volatility, which typically precedes strong directional moves.

The Bollinger Bands have been contracting since late July, confirming that the market is in a low-volatility phase. Statistically, such periods are followed by significant breakouts, though the direction depends on whether bulls or bears take control.

From a macro perspective, XRP’s potential upside is supported by ongoing positive sentiment surrounding Ripple Labs’ legal standing in the U.S., following partial victories in court earlier this year. While regulatory uncertainty remains, each favorable development has historically provided a tailwind for XRP prices.

Fundamentally, increased adoption of Ripple’s cross-border payment solutions and growing institutional interest in XRP as a liquidity tool could help sustain any technical breakout. This synergy between technical readiness and fundamental optimism adds weight to the bullish case.


Short-Term Risks and Key Levels to Watch

While optimism is building, traders must be aware of the short-term risks. Failure to break above the descending trendline could result in renewed selling pressure, potentially driving XRP back toward the $3.06 support. A decisive close below this level might open the door for a deeper pullback toward $2.84, which marks the lower Bollinger Band and a previous consolidation floor.

For now, key levels to watch are:

  • Resistance 1: $3.28–$3.30 (descending trendline)
  • Resistance 2: $3.37 (upper Bollinger Band)
  • Resistance 3: $3.50 (psychological and historical barrier)
  • Support 1: $3.06 (horizontal + mid-Bollinger Band)
  • Support 2: $2.84 (lower Bollinger Band)

If XRP manages a breakout with daily volume exceeding the recent average, the odds of sustaining upward momentum will improve significantly. Conversely, a failed breakout attempt could lead to choppy, sideways action as the market reassesses its direction.


Future Outlook: XRP at a Crossroads

Looking ahead, XRP is entering a high-stakes phase where technical and fundamental factors are converging. A successful breakout above the trendline could trigger a run toward $3.50 and potentially $3.70, levels not seen since earlier in the summer rally. Such a move would also strengthen the broader bullish narrative in the cryptocurrency market, especially if Bitcoin and Ethereum maintain upward momentum.

However, traders must also prepare for the possibility of extended consolidation. The crypto market remains sensitive to macroeconomic developments, regulatory headlines, and shifts in risk sentiment. The next U.S. inflation data release, for example, could influence both traditional and digital asset markets.

In summary, XRP is at a technical tipping point. The next decisive move will likely set the tone for the rest of August and could have lasting implications for its trend in Q4. Market participants are advised to monitor volume, resistance levels, and broader crypto sentiment closely before making high-leverage bets.


Disclaimer:
This article is for informational purposes only and does not constitute financial advice. Cryptocurrency investments carry high risk, and you should only invest what you can afford to lose. Always conduct your own research or consult a financial advisor before making trading decisions.

Bitcoin Price Eyes $120K Breakout: Key Levels, Chart Patterns, and Market Sentiment Explained

Bitcoin Climbs Toward $120K as Technical Indicators Signal Potential Breakout

17

Introduction:
Bitcoin (BTC) is inching closer to the $120,000 mark, a key resistance level that could determine its short-term direction. Over the past week, the world’s largest cryptocurrency has seen renewed buying interest, with bullish patterns forming on the daily chart. Traders are closely monitoring the $120,900 zone, where previous rallies have faced selling pressure. A confirmed breakout above this threshold could trigger a fresh leg higher, potentially setting new all-time highs, while failure to do so might invite sharp profit-taking.


Bitcoin Price Consolidates Below Major Resistance

Bitcoin’s recent rally has been marked by a series of higher lows, indicating sustained buying momentum. The daily chart shows BTC trading just below a horizontal resistance around $120,900 — a level that has capped upward movement multiple times over the past month. The price is currently supported by an ascending trendline and the 20-day simple moving average (SMA), both acting as short-term bullish indicators. The Bollinger Bands are tightening, a classic sign that a significant price move could be imminent.


Bitcoin daily chart showing ascending trendline support and resistance near $120,900.


In technical analysis terms, the market structure remains bullish as long as Bitcoin stays above the $116,000–$116,800 zone, which aligns with the middle Bollinger Band. This area has repeatedly acted as a demand zone for traders looking to accumulate positions. Volume trends also reveal growing participation on up days, indicating that the latest upward moves are supported by genuine buying interest rather than low-liquidity spikes.

Market analysts, such as crypto strategist Michaël van de Poppe, have noted that Bitcoin’s ability to hold above $118,000 after multiple retests of support reflects strong resilience. “We are approaching a decision point,” van de Poppe said in a recent market update. “Either we break through and see an acceleration to new highs, or we face another rejection and retest the $112,000–$113,000 levels.”


Bullish Catalysts Driving the Market

One of the primary factors behind Bitcoin’s recent strength has been improving macroeconomic sentiment. With inflation in key economies showing signs of slowing and central banks hinting at a potential pause in interest rate hikes, risk assets such as cryptocurrencies are finding renewed favor among investors. Additionally, institutional demand remains strong, with spot Bitcoin ETFs seeing consistent inflows over the past two weeks.

On-chain data supports the bullish narrative. Glassnode reports that the number of Bitcoin addresses holding more than 1 BTC has reached an all-time high, indicating accumulation by retail investors. Furthermore, exchange reserves are at multi-year lows, suggesting that fewer coins are readily available for sale, which could add to supply-side pressure if demand continues rising.

Another important development is the upcoming Bitcoin halving, expected in less than a year. Historically, halvings have preceded major price rallies as the reduction in block rewards tightens new supply. Analysts believe this cycle could be no different, especially given the heightened interest from traditional finance and the broader adoption of Bitcoin as a hedge asset.


Technical Outlook: Breakout or Reversal?

From a chartist’s perspective, Bitcoin’s path in the coming days depends largely on how it interacts with the $120,900 resistance. A decisive daily close above this level, ideally accompanied by high trading volume, would be considered a breakout. In such a scenario, immediate upside targets could be $123,500 and $126,000, with the potential for a push toward $130,000 if momentum accelerates.

However, traders are also aware of the risk of a “fakeout,” where price briefly moves above resistance only to fall back below, trapping late buyers. The current ascending triangle pattern supports a bullish resolution, but if the trendline is broken and Bitcoin closes below $116,000, bearish momentum could take over, leading to a retest of $112,600 and possibly $110,000.


Outlook for the Coming Weeks.

Looking ahead, Bitcoin’s price movement is likely to be shaped by a combination of technical triggers and macroeconomic news. Any significant developments in the regulatory landscape — particularly regarding crypto ETFs and global taxation policies — could either fuel the rally or dampen sentiment. For now, the market appears cautiously optimistic, with traders positioning for a potential breakout but prepared for volatility.

If Bitcoin successfully breaks and holds above $120,900, the bullish momentum could attract a fresh wave of retail and institutional buyers. On the other hand, repeated failures at this level might shake short-term confidence, prompting a period of sideways consolidation before the next major move.


Disclaimer:
This article is for informational purposes only and does not constitute financial advice. Cryptocurrency investments are highly volatile and carry risk. Always conduct your own research before making any investment decisions.

Ethereum Smashes Past $4,400 as Bulls Eye New Record Highs: Is $5,000 Next?

Ethereum Smashes Past $4,400 as Bulls Eye New Record Highs: Is $5,000 Next?

38

Introduction

Ethereum (ETH) surged 4.70% in Tuesday’s trading session, closing at $4,424.20 and marking a decisive breakout above its previous high of $4,137.86. The second-largest cryptocurrency by market capitalization is now trading at levels not seen in months, buoyed by strong technical momentum, increasing network activity, and renewed investor confidence in the broader crypto market. With Ethereum now firmly above its old resistance, analysts are debating whether this move sets the stage for a push toward the much-anticipated $5,000 milestone.


Ethereum Breaks Old Resistance to Set a New High

Ethereum’s recent rally has pushed it above a key technical barrier — the old high of $4,137.86 — which had acted as a ceiling for several weeks. The breakout is supported by a solid uptick in trading volume, indicating strong participation from both retail and institutional traders.

Bollinger Bands analysis reveals ETH is now riding the upper band, a sign of bullish momentum and volatility expansion. The 20-day simple moving average (SMA) at $3,832.16 remains well below the current price, confirming a healthy uptrend structure. Historically, when Ethereum has broken significant resistance levels with this level of conviction, it has often led to multi-week rallies.

“Ethereum daily chart showing breakout above old high with strong volume and bullish momentum.”


Traders are now eyeing the $4,500 psychological level as the next short-term target. Should ETH maintain this breakout and avoid a quick retracement, the path toward $4,800–$5,000 becomes increasingly plausible.

“The $4,100 zone was the last major hurdle before Ethereum could open the gates to higher valuations,” explained David Lin, a crypto market strategist. “With network upgrades and DeFi activity picking up, this breakout could be the beginning of a sustained rally into Q4.”


Fundamentals Backing the Rally

While technical factors are crucial for short-term trading, Ethereum’s current rally also has strong fundamental drivers. The recent upgrade to Ethereum’s network, aimed at improving scalability and reducing transaction costs, has attracted renewed interest from developers and investors alike.

Decentralized Finance (DeFi) protocols and NFT marketplaces continue to see robust activity, much of which is built on the Ethereum blockchain. According to on-chain analytics, daily active addresses have risen steadily over the past month, while transaction volume has surpassed $15 billion in 24 hours for the first time in several weeks.

Moreover, Ethereum’s staking ecosystem remains healthy. With over 32 million ETH now staked, supply on exchanges has tightened, reducing selling pressure and potentially supporting higher prices. The growing appeal of Ethereum ETFs, following the success of Bitcoin ETFs, has also been a significant factor in attracting institutional flows into the asset.


Market Sentiment and Potential Risks

The broader crypto market sentiment has improved in recent weeks, fueled by Bitcoin’s stability above $60,000 and increasing adoption by traditional finance institutions. Ethereum, as the leading smart contract platform, stands to benefit disproportionately from this wave of optimism.

However, analysts caution that the road to $5,000 may not be without challenges. The crypto market remains highly sensitive to regulatory developments, macroeconomic data, and shifts in risk sentiment. A sudden increase in U.S. Treasury yields, unexpected inflation data, or adverse regulatory announcements could quickly trigger profit-taking.

Technical traders are also aware of the risk of a “bull trap” — a scenario where prices briefly breach resistance before reversing sharply. For Ethereum, a daily close back below $4,137 would raise concerns about the sustainability of the breakout and could trigger a short-term correction toward $3,900–$3,800.


Outlook: Can Ethereum Hit $5,000?

Looking ahead, the key question for traders and investors is whether Ethereum has enough momentum to challenge its all-time high near $4,900 and push toward the symbolic $5,000 mark.

For this to happen, ETH must sustain its breakout and see continued volume inflows, particularly from institutional players. Watch for consolidation above $4,200–$4,300, as this would indicate strong buyer support. If momentum indicators such as RSI and MACD remain in bullish territory, a retest of $4,800 could come sooner than expected.

In the medium to long term, Ethereum’s growth prospects are tied to the success of its ongoing network upgrades, DeFi adoption, and integration into mainstream finance. A favorable macroeconomic environment, combined with strong fundamentals, could pave the way for Ethereum to not only test but surpass $5,000 in the months ahead.


Disclaimer: This article is for informational purposes only and should not be taken as financial advice. Cryptocurrency investments are highly volatile and carry significant risk. Always conduct your own research before making investment decisions.

Title: Dow Jones Surges Past Key Resistance as Bulls Eye 45,000: Is the Uptrend Back on Track?

Title: Dow Jones Surges Past Key Resistance as Bulls Eye 45,000: Is the Uptrend Back on Track?

14

Introduction

The Dow Jones Industrial Average (DJIA) ended Tuesday’s session with a strong rally, closing at 44,446.70 — up 471.61 points or 1.07%. The index’s bullish breakout above a short-term downtrend line and horizontal support zone has reignited optimism among traders. Technical indicators, including Bollinger Bands and moving averages, suggest a potential continuation of the upward momentum toward the 45,000 psychological level. However, with mixed macroeconomic signals and geopolitical uncertainties still looming, market participants remain cautiously optimistic about the path ahead.


Dow Jones Breaks Out of Short-Term Downtrend

After several sessions of sideways trading, the Dow Jones has successfully broken above a descending trendline that had capped gains since late July. This breakout follows a consolidation phase around the 44,000 level, which served as both psychological and technical support. Traders often view such price action as a healthy reset after a prior rally, allowing the market to absorb selling pressure before moving higher.

The breakout is further validated by the price reclaiming its 20-day simple moving average (SMA), which is closely watched by short-term traders. Bollinger Band analysis shows the index bouncing off its lower band and heading toward the midline, indicating a potential expansion in volatility to the upside. Historically, similar setups have led to notable rallies in the weeks that follow, provided macroeconomic conditions remain supportive.

“Dow Jones Industrial Average daily chart showing breakout above short-term downtrend line and key support.”


Following the breakout, market sentiment has shifted. The 44,000 level, previously a battleground between bulls and bears, now acts as a near-term support zone. This level aligns with previous swing lows seen in early July, making it a strong floor for price action. On the upside, the immediate target is the 45,000 mark, followed by the year’s high near 45,076 — which also coincides with the upper Bollinger Band.

Analysts note that the strong green candle accompanying the breakout is backed by above-average intraday volume, adding weight to the move. “When you get a decisive breakout on high volume, it often signals that institutional buyers are stepping in,” said Maria Chen, senior market strategist at NY Financial Insights. “If the Dow can hold above 44,300 over the next few sessions, we could see momentum-driven buying push the index toward new highs.”


Macro Tailwinds Support Technical Breakout

While chart patterns are crucial for short-term traders, broader market forces play an equally important role. This recent rally in the Dow comes amid a backdrop of easing U.S. Treasury yields, which have reduced pressure on equity valuations. Lower yields often make stocks more attractive relative to bonds, particularly for dividend-heavy indices like the Dow.

Additionally, investor sentiment has been bolstered by recent economic data suggesting that the Federal Reserve might be nearing the end of its tightening cycle. The latest CPI print came in slightly below expectations, hinting at moderating inflation pressures. This gives the Fed more flexibility to maintain a balanced approach, potentially avoiding aggressive rate hikes that could stifle economic growth.

Corporate earnings have also played their part. Several Dow components, including technology and industrial giants, have posted better-than-expected quarterly results. This has helped offset weakness in certain consumer sectors that are feeling the pinch from higher prices. Furthermore, resilient labor market data has reassured investors that the U.S. economy remains robust despite global uncertainties.

Traders are now keeping an eye on upcoming retail sales data and the Fed’s meeting minutes, both of which could influence the sustainability of this breakout. A dovish tilt in Fed commentary could act as a further catalyst for risk assets, while any hawkish surprises might test the newfound bullish momentum.


Risk Factors and Market Caution

Despite the bullish technical setup, risks remain. The global economic environment is still volatile, with geopolitical tensions, supply chain disruptions, and fluctuating commodity prices posing potential headwinds. Any escalation in trade disputes or unexpected policy changes could dampen investor sentiment.

Moreover, technical traders are aware that false breakouts are not uncommon, especially in markets where sentiment can shift rapidly. A failure to sustain levels above 44,300 could invite fresh selling pressure, pushing the Dow back toward its lower support zones around 43,800 and 43,600. In such a case, the short-term uptrend would be at risk of reversal.

Market veterans also caution that the broader U.S. equity market is entering a historically volatile period. August and September have often been challenging months for stocks, with seasonal weakness compounded by lower trading volumes in the summer. This means that while the recent breakout is encouraging, sustained follow-through will be necessary to confirm a genuine trend reversal.


Future Outlook: Will Bulls Push Toward Record Highs?

Looking ahead, the Dow’s path to 45,000 and beyond will depend on a combination of technical resilience and favorable macroeconomic developments. If upcoming data releases continue to point toward moderating inflation and stable growth, the probability of a sustained uptrend increases.

Technical analysts highlight that a close above 45,076 — the recent peak — would mark a new breakout into uncharted territory, potentially setting the stage for a run toward 45,500 and even 46,000. On the flip side, any significant negative surprise in economic data or corporate earnings could quickly derail this bullish scenario.

For now, traders are advised to monitor support at 44,300 closely, while keeping an eye on volume trends to gauge institutional participation. A gradual grind higher accompanied by healthy volume and breadth would signal that the rally has more legs.


Disclaimer: This article is for informational purposes only and does not constitute financial advice. Investors should conduct their own research or consult a licensed financial advisor before making investment decisions.

Top 50 Crypto Coins

Bitcoin Price Eyes $120K Breakout: Key Levels, Chart Patterns, and Market Sentiment Explained


Introduction

Bitcoin (BTC) is once again approaching a crucial resistance level as bullish momentum builds on the daily chart. After bouncing from the $112,000 zone earlier this month, the leading cryptocurrency has been forming a steady upward trendline, signaling renewed buying pressure. With prices currently trading near $116,960 and the $120,000 level in sight, traders are closely watching for a breakout that could trigger the next significant rally. However, the looming resistance and mixed market signals suggest a breakout won’t come without a fight.


Bitcoin’s Ascending Trendline Signals Growing Bullish Momentum

Bitcoin’s recent recovery has been marked by a series of higher lows since early August, a classic sign of bullish market structure. The ascending trendline visible on the daily chart reflects consistent buying interest, with each dip being met with strong demand. This momentum has been supported by the 20-day simple moving average (SMA), which is acting as a dynamic support line.

The Bollinger Bands are narrowing compared to late July’s volatility, suggesting the market is entering a squeeze phase. Historically, such squeezes have preceded large price swings. The upper Bollinger Band currently aligns with the $121,175 level — a point that matches historical resistance from previous price rejections. This confluence makes $121K a critical level to watch for breakout traders.

Meanwhile, trading volumes have shown moderate but steady growth over the past week, indicating that participation is increasing as prices approach resistance. A decisive break above $120,091 could pave the way toward $124,000 and potentially $128,000 in the short term, but failure to breach this level might trigger a pullback toward the $115,000–$114,000 range.

“Bitcoin daily chart showing ascending trendline and key resistance near $120K.”


Volume and Market Participation Show Strength

A deeper look at volume patterns reveals that buying pressure is becoming more consistent. The daily candles over the past five sessions have largely closed in the green, showing that bulls are gradually gaining control. While the volume spikes are not as dramatic as early July’s breakout from $110K, the steady accumulation pattern suggests that market participants are positioning ahead of a possible move.

Historical behavior around similar ascending trendline setups shows that Bitcoin often sees two scenarios:

  1. Breakout scenario: Price surges past the resistance with high volume, triggering a rapid move toward the next major psychological level.
  2. False breakout and retest: Price breaks above resistance briefly but quickly reverses, trapping late buyers and causing a sharp sell-off.

Currently, the Relative Strength Index (RSI) is hovering just below the overbought zone, around 62–64, indicating there is still room for further upward momentum before exhaustion sets in. Analysts are advising traders to watch for volume confirmation before taking large breakout positions.

A senior market strategist at CryptoInsights, Michael Tanner, commented:

“We’re seeing a healthy setup for Bitcoin, but it’s crucial to understand that resistance at $120K has held multiple times in the past. A true breakout requires a strong surge in buying volume — otherwise, we could see another pullback.”


Macro and Sentiment Factors Influencing Bitcoin’s Next Move

While technical charts suggest bullish momentum, macroeconomic factors could play a decisive role in whether Bitcoin can sustain a breakout. The broader crypto market has been recovering amid easing inflation fears in the U.S. and expectations that the Federal Reserve may hold interest rates steady in the coming quarter. This macro backdrop has historically been favorable for risk-on assets like Bitcoin.

In addition, institutional participation remains steady, with Bitcoin exchange-traded funds (ETFs) seeing modest inflows over the past two weeks. On-chain data also indicates a rise in wallet addresses holding between 10–100 BTC, suggesting that mid-sized investors are accumulating during the current consolidation.

However, potential headwinds remain. Regulatory discussions in the U.S. and Europe about stricter crypto compliance could dampen sentiment in the short term. Furthermore, if the U.S. dollar strengthens unexpectedly due to macro shocks, Bitcoin could face renewed selling pressure as traders shift toward safer assets.

This balance between bullish technical structure and uncertain macro developments is likely to define Bitcoin’s path over the next two weeks. Traders are being urged to remain flexible and use stop-loss strategies to manage risk during this potentially volatile phase.


$120K Resistance: The Gateway to Bitcoin’s Next Rally

The $120K level has emerged as one of the most significant price barriers for Bitcoin in recent months. Price action since late July has repeatedly tested this zone but failed to sustain a close above it. This resistance has psychological importance because it’s a round number and also aligns with previous high-volume nodes on the volume profile.

If Bitcoin breaks and closes above $120,091 with strong daily volume, it could open the door for a swift rally toward $124,000, followed by $128,500 — levels that correspond with prior swing highs. The measured move from the ascending triangle pattern also points toward a potential upside target in this range.

On the flip side, if Bitcoin fails to breach $120K and falls below the ascending trendline near $115,800, it could trigger a correction toward $114K or even $112,600. The latter is a key support level from earlier this month and coincides with the lower Bollinger Band, making it a critical point for bulls to defend.

Market watchers should also note that volatility tends to spike after such prolonged periods of consolidation. As a result, traders should be prepared for rapid price swings in either direction once Bitcoin tests this critical level.


Conclusion and Outlook

Bitcoin is approaching a make-or-break moment on the daily chart. The ascending trendline, narrowing Bollinger Bands, and growing trading volumes all hint at a possible breakout toward $120K and beyond. However, the market’s recent history at this resistance level reminds us that bullish setups can quickly turn into false breakouts without the necessary volume support.

For long-term investors, the current setup may offer a favorable entry point, provided they are prepared for short-term volatility. For traders, the key will be to watch for confirmation signals — including a daily close above $120,091 with strong volume — before committing to larger positions.

In the days ahead, macroeconomic news, institutional flows, and broader crypto market sentiment will likely shape whether Bitcoin breaks out or retreats for another consolidation phase.


Disclaimer: This article is for informational purposes only and does not constitute financial advice. Cryptocurrency investments are subject to high market risk, and past performance is not indicative of future results. Always conduct your own research before making investment decisions.

Top 50 Crypto Coins

Dow Jones Industrial Average Rises Amid Key Support Test, Eyes Resistance Levels in August 2025

17

Introduction

The Dow Jones Industrial Average (DJIA) is navigating a critical technical juncture as August 2025 unfolds. After a period of choppy trading and recent volatility, the index is holding above a crucial support zone while attempting to reclaim short-term momentum. Traders are closely watching price action between the 43,700–44,200 range, as this area may determine the market’s next directional move. With macroeconomic uncertainty, earnings season catalysts, and Federal Reserve policy expectations in play, the DJIA’s behavior in the coming sessions could signal whether the bulls regain control or the bears force a deeper correction.


Key Technical Levels Define the Dow’s Short-Term Path

“Dow Jones Industrial Average testing critical support near 43,700 while facing resistance around 44,360 in early August 2025.”

The Dow Jones recently rebounded from a sharp sell-off, which briefly pushed the index below its mid-term moving averages. The bounce from near 43,690 has brought the price back above the short-term support line, but resistance remains strong near the 44,360 level, which coincides with the 20-day Bollinger Band midline.

Technical indicators are sending mixed signals. The Bollinger Bands show price compressing after a recent volatility spike, hinting at a potential breakout ahead. The 20-day simple moving average (SMA) has flattened, suggesting the trend is pausing rather than reversing. Support at 43,690 is being reinforced by a horizontal demand zone dating back to mid-June, where buyers previously stepped in aggressively.

Market analysts note that the 45,037–45,076 zone remains a formidable resistance band. “This is where the Dow needs to close decisively above to signal renewed bullish strength,” says Jonathan Blake, senior equity strategist at NY Market Insights. “Until then, we’re in a consolidation phase, and traders should be prepared for whipsaws.”


The Dow’s performance this week comes against the backdrop of broader market resilience. Despite headwinds from mixed corporate earnings and geopolitical developments, blue-chip stocks in industrials, technology, and healthcare have kept the index from sliding deeper. However, weakness in financials and energy is capping upside momentum.

For traders, the focus remains on how price interacts with the Bollinger Band midline and whether buyers can sustain momentum past 44,363. A breakout above this level could open the path toward retesting 45,000+, while a breakdown below 43,690 could invite further selling toward 43,200 and even 42,800.


Market Context: Economic and Policy Drivers

The Dow’s technical setup cannot be viewed in isolation. Macroeconomic data and Federal Reserve policy expectations are major drivers of investor sentiment.

July’s jobs report revealed the slowest hiring pace since the pandemic recovery phase, sparking renewed discussions about the Fed’s interest rate stance. The two-year Treasury yield, which briefly touched 3.95%, has since eased, signaling market bets on potential rate cuts before year-end.

“Softening labor data combined with moderating inflation could give the Fed room to pivot,” remarks Linda Chen, chief economist at Horizon Capital Partners. “But any unexpected inflation uptick would quickly shift the narrative, keeping volatility elevated.”

Meanwhile, corporate earnings season has been mixed. While tech giants posted solid revenue growth, consumer staples and cyclical sectors faced margin pressures due to lingering cost increases. This sectoral divergence is reflected in the Dow’s choppy trading pattern.

Global factors are also in play. The U.S. dollar’s rebound in July (+2.7%) is exerting pressure on exporters, while ongoing tariff disputes with major trading partners add a layer of uncertainty for multinational companies represented in the index.

For investors, these cross-currents mean that technical levels on the DJIA are more than just chart lines—they are decision points shaped by real-world fundamentals and policy shifts.


Outlook: Will Bulls Break the Stalemate?

The path forward for the Dow hinges on whether buyers can push through the 44,360 resistance and sustain gains toward 45,000+. A decisive breakout would likely draw momentum traders back into the market, with potential for a retest of July highs.

However, failure to break higher could see the index drift sideways or revisit lower supports. The 43,690 level is crucial; a close below it would tilt the balance in favor of bears and could trigger a swift drop toward 43,200.

Over the medium term, analysts remain cautiously optimistic. The U.S. economy’s 3% annualized growth in Q2, coupled with easing commodity prices, provides a supportive backdrop. Yet, persistent sectoral divergences and global macro risks mean that volatility will remain a defining feature of trading in the coming months.

For now, traders are advised to remain nimble—balancing exposure between defensive positions and selective growth plays—while keeping a close watch on the Dow’s reaction to these technical pivot points.


Disclaimer: This article is for informational purposes only and does not constitute financial advice. Investors should consult with qualified professionals before making trading or investment decisions.

Global Finance 2025: Strategies for Thriving in a Year of Transformation and Uncertainty

Global Finance 2025: Strategies for Thriving in a Year of Transformation and Uncertainty

21

Introduction

The financial world in 2025 is a complex blend of resilience, innovation, and unpredictability. Inflationary pressures, shifting central bank policies, and geopolitical undercurrents are reshaping how economies function and how investors navigate the markets. While some sectors are riding high on optimism, others are bracing for volatility. From the rapid evolution of digital finance to the recalibration of investment strategies, this is a year where adaptability is the ultimate currency. In this analysis, we explore the trends, risks, and strategic shifts defining the global financial landscape today.


Market Pulse: The 2025 Investment Climate

August 2025 has painted an intriguing picture for global markets—an interplay of record highs and cautionary signals.

The S&P 500 has surged 8.6% year-to-date (YTD), driven largely by powerhouse performances in large-cap technology and industrial stocks, up 13.7% and 16.1% respectively. Yet, small-cap stocks remain turbulent, reflecting investor hesitancy amid uncertain macroeconomic signals. Defensive sectors, such as utilities, are losing their shine as elevated interest rates reduce the appeal of income-focused assets.

Internationally, the MSCI EAFE Index dipped 1.4% in July but still shows a strong 17.8% gain for the year. Emerging markets are close behind at 17.5%, buoyed by improved trade conditions and an earlier slide in the U.S. dollar. However, July’s 2.7% rebound in the greenback suggests shifting global trade winds.

Bond markets have remained subdued, with broad indexes dropping 0.26% in July—marking their second consecutive month in the red. Treasury yields saw an uptick, with the two-year touching 3.95% before retreating after weaker-than-expected U.S. job data in August. The Federal Reserve’s decision to hold rates steady in July, despite political calls for cuts, has strengthened market perceptions of a cautious, data-driven approach.

The U.S. economy continues to outperform growth forecasts, clocking a 3% annualized GDP rate in Q2, powered by robust consumer spending and reduced imports. Still, labor market cooling—July saw the weakest hiring since the pandemic—has sparked concerns over the durability of the current expansion.


Deregulation, M&A Momentum, and Regional Realignment

One defining financial trend of 2025 is the revival of mergers and acquisitions (M&A), especially across the U.S. and Europe. Regulatory relaxation by the new U.S. administration has invigorated dealmaking, aided by lower borrowing costs and strong liquidity.

While total global deal volume in H1 2025 dropped 9% year-on-year, deal value jumped 15%, with megadeals dominating headlines. Examples include:

  • Google’s proposed $32 billion acquisition of Wiz (technology)
  • Constellation Energy’s $26.6 billion bid for Calpine (energy)
  • Global Payments’ $24.25 billion takeover plan for Worldpay (banking)

Domestic and intra-regional deals are gaining preference as cross-border activity faces tariff headwinds and political risk. Fintech continues to evolve, despite softer venture capital inflows since 2022, and asset managers are leaning into alternative investments and digital infrastructure to maintain growth momentum.


Inflation: Progress, But Not Victory

Global inflation is on a downward path, projected at 4.4% for 2025 versus 5.8% in 2024, helped by easing commodity prices and moderated wage growth. But not all economies are enjoying smooth disinflation.

In the U.S., CPI inflation rose to 2.7% in June from 2.4% in May, partly due to tariff-induced cost pressures. The U.K. posted 3.6% in June, while emerging markets like Venezuela remain trapped in hyperinflation (400%), with Zimbabwe and Argentina facing similar instability.

Central banks are diverging in their responses:

  • U.S. Federal Reserve: Rates held at 4.25%–4.5%
  • Bank of England: Cut rates to 4% in August amid easing inflation
  • ECB & Bank of Japan: Pausing easing cycles, watching trade and wage data closely

While the eurozone and Sweden could see inflation dip below 2% by year-end, the U.S. faces stickier core inflation at an estimated 3.4% annualized for H2 2025.


The Digital Finance Revolution

Technology is rewriting the rules of global finance. The Global Findex Database 2025 shows rapid growth in digital banking, mobile payments, and AI-powered wealth management. The push for financial inclusivity—particularly narrowing the gender gap in account ownership—is gaining traction worldwide.

Banks are restructuring to deliver faster, more personalized, and seamless digital experiences, relying on AI, data analytics, and cloud-based systems. Investors are diversifying, with growing allocations toward precious metals (gold, silver, platinum) and emerging market equities.

While U.S. tariff policies have slowed household consumption, they haven’t derailed overall growth. Strategic investment preferences now lean toward:

  • Shorter bond maturities
  • Healthcare, technology, and energy sectors
  • Markets in the UK, Hong Kong, South Korea, and China

Outlook: Balancing Risk and Opportunity

The global growth outlook for 2025 has been upgraded to 3.0%, with 2026 expected at 3.1%. Yet risks remain—from trade tensions and tariff escalations to sudden shifts in monetary policy.

Opportunities ahead include:

  • Harnessing AI and big data for investment decision-making
  • Leveraging M&A to diversify portfolios and enter new markets
  • Expanding into emerging digital finance ecosystems

Challenges include:

  • Maintaining resilience in the face of geopolitical uncertainty
  • Managing inflationary flare-ups triggered by energy or commodity shocks
  • Adapting to fast-changing consumer and investor behavior

Bottom line: In 2025, success in finance is not about predicting the future perfectly—it’s about adapting faster than the competition. Those who embrace flexibility, invest strategically, and innovate relentlessly will be best positioned to thrive in this unpredictable environment.


Disclaimer: The information presented is based on the latest data and market insights. It is not intended as investment advice. Readers should consult qualified professionals before making financial decisions.

Top 50 Crypto Coins