Home Blog Page 4

Dow Jones Struggles Below Resistance: Technical Signals Hint at Caution Ahead

23

Introduction:
The Dow Jones Industrial Average (DJIA) faced stiff resistance on August 7, 2025, as it hovered near a crucial price ceiling around 44,390–45,000 levels. Despite recent bullish momentum, the index is now battling multiple technical hurdles, with Bollinger Bands, trendlines, and resistance zones all aligning to create pressure. Market participants are closely watching these developments as indicators hint at a possible trend reversal or a tight consolidation phase. Understanding these technical cues is essential for traders navigating the U.S. equities landscape.


Key Resistance Zones May Stall Further Upside Momentum

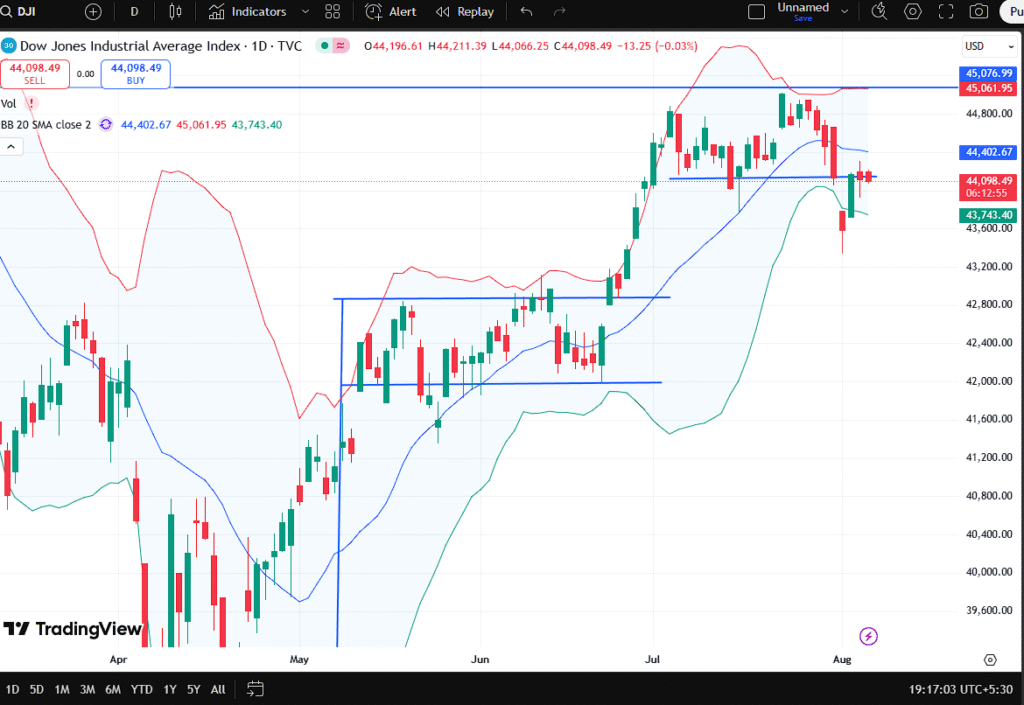
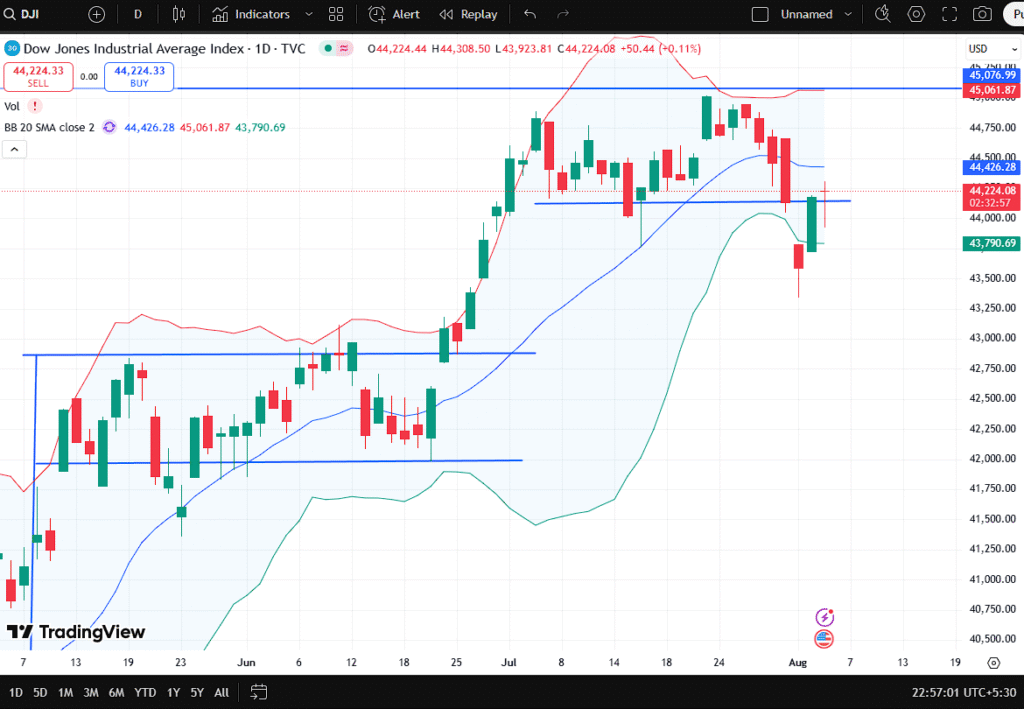
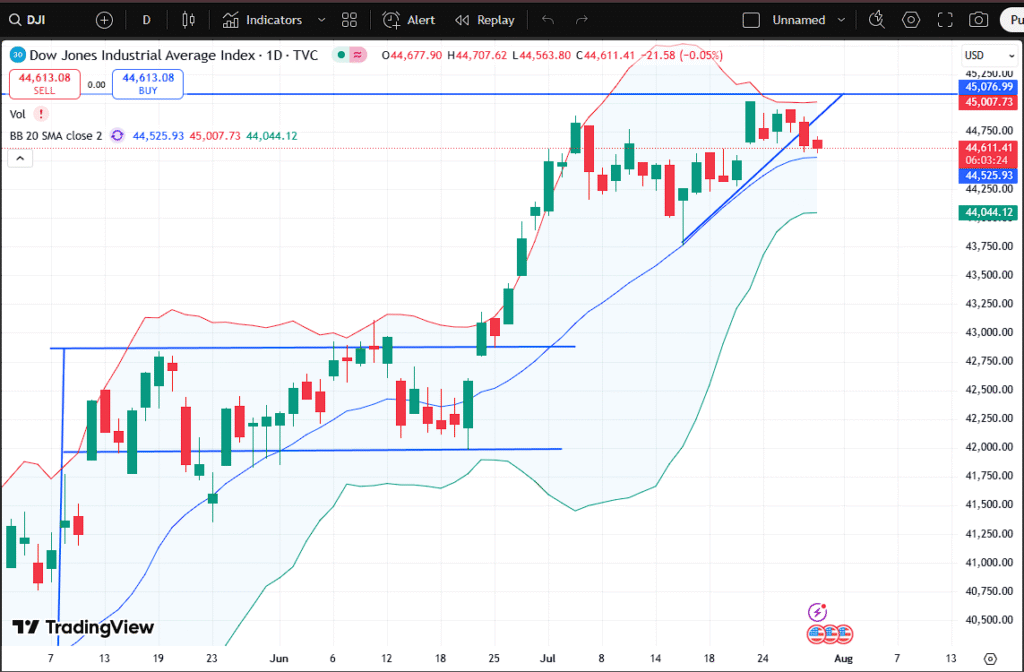
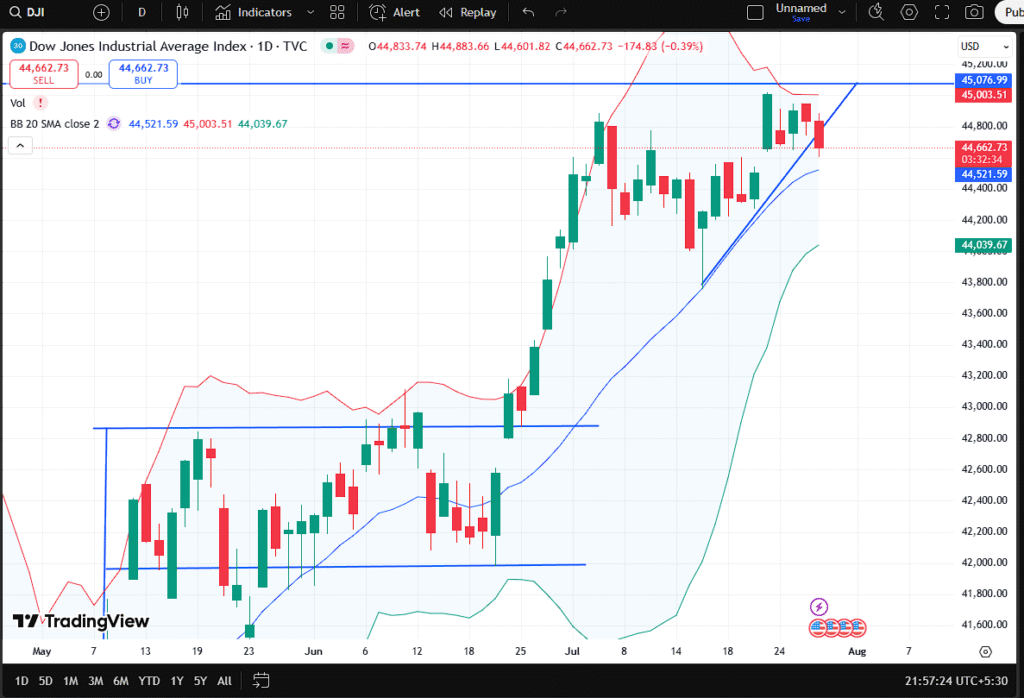
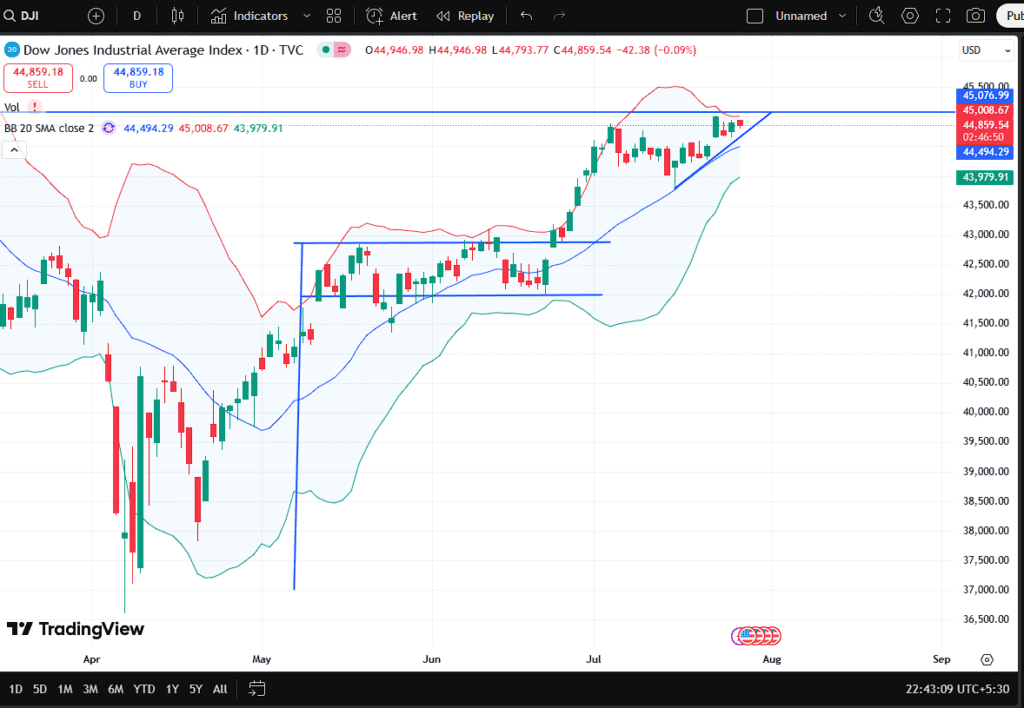
The recent trading activity in the DJIA shows a classic case of the price meeting resistance after a swift recovery from a lower support zone. The index has climbed from a low near 43,000 to around 44,333, supported by a steep upward trendline and rising volume. However, as the chart indicates, the price is facing resistance at both the midline of the Bollinger Band (44,391) and the upper blue horizontal line near 45,000—a psychological and historical resistance level.

DJIA chart showing resistance near 44,391–45,000 zone with price rejection at key Bollinger Band midline

The chart clearly shows multiple price rejections at the upper range between 44,800–45,000, suggesting that sellers are active in this zone. Moreover, the red candle on August 7 indicates a failed attempt to close above the Bollinger Band midline, signaling weakness. The Bollinger Band structure further confirms this, as the bands have started contracting—a sign that volatility is reducing and a potential consolidation or reversal could follow.

Technical traders are also observing the symmetrical triangle pattern formed by the upward sloping trendline and the horizontal resistance. A breakout above this triangle would require strong bullish momentum and high volume. On the other hand, a break below the trendline could trigger a correction toward the lower Bollinger Band at 43,748 or even lower support near 43,200.


Bullish Momentum Faces Headwinds from Broader Market Sentiment

Despite the positive sentiment across major tech stocks and earnings surprises, the DJIA seems relatively weaker compared to other indices like the Nasdaq 100 or S&P 500. One of the main concerns among institutional investors is macroeconomic uncertainty—primarily around inflation persistence and the Federal Reserve’s next interest rate decision.

The U.S. 10-year Treasury yield remains elevated, which has historically capped equity rallies, especially in industrials and cyclical sectors that dominate the DJIA. Additionally, the recent oil price fluctuations and global slowdown fears, including weak Chinese export data, are dampening risk appetite.

From a technical perspective, although the recent lows near 43,000 have held firm and the short-term trendline provides support, the bulls need to push decisively above the 44,800–45,000 zone to confirm further upside. Failure to do so could result in a sideways consolidation or a deeper pullback, especially if volume dries up or economic data disappoints.

Investors are also wary of the narrow breadth in this rally—only a few heavyweights are driving the gains. Breadth indicators like the Advance-Decline Line (ADL) are not in full agreement with the index’s upward momentum, which could be a warning signal.


What Traders Should Watch: Breakout or Breakdown?

With the DJIA stuck between strong support and resistance, the next move will likely be dictated by external events and technical breakout confirmation. On the bullish side, if the price manages to close above the resistance level of 45,034 with rising volume, it could trigger a breakout and possibly a retest of the 46,000 mark.

Conversely, a daily close below the trendline and mid-Bollinger Band (around 44,000) may indicate loss of momentum and result in selling pressure toward the lower band near 43,748 or even down to the 43,200 range. RSI and MACD indicators (not shown in the chart but commonly used) should also be monitored for divergence or crossover signals to validate the move.

The Bollinger Band contraction is especially important. When Bollinger Bands contract and the price remains range-bound, a sharp directional move is typically expected. Whether it results in an upward or downward breakout depends on economic catalysts like inflation data, job reports, and upcoming Fed commentary.

Traders are advised to keep stop losses tight, avoid aggressive positions until a breakout or breakdown is confirmed, and use trend-based indicators like moving averages and ADX to confirm trend strength.


Conclusion: DJIA at a Technical Crossroads—Volatility Expected

The Dow Jones Industrial Average currently sits at a critical technical juncture. While the short-term trend appears bullish, multiple resistance levels and declining volatility (as shown by the Bollinger Bands) point to an impending big move. Whether the index breaks upward or corrects downward will depend heavily on macroeconomic data and market sentiment in the coming days.

For now, traders should watch the key resistance level around 45,034 and support near 43,748–43,200 closely. A breakout above or breakdown below this range will likely determine the next trend direction.

Long-term investors might consider waiting for confirmation before making fresh entries, while swing traders can take advantage of the volatility with tight risk management.


Disclaimer:
The information provided in this article is for educational and informational purposes only and should not be construed as financial advice. Trading and investing in the stock market involve risk. Please consult with a professional financial advisor before making any investment decisions.

Trump’s 50% Tariff Blowback: Can India–US Trade Ties Survive the Russian Oil Rift?

Trump’s 50% Tariff Blowback: Can India–US Trade Ties Survive the Russian Oil Rift?

18

Introduction
On August 7, 2025, U.S. President Donald Trump unleashed a political and economic storm by slapping a 50% tariff on Indian goods—doubling his earlier 25% levy in response to India’s continued import of Russian oil. The move has stirred strong reactions across diplomatic corridors, rattled markets, and opened a new chapter in the evolving India–U.S. relationship. At the heart of the dispute lies New Delhi’s pursuit of affordable energy for its vast population and Washington’s bid to isolate Moscow globally. As tensions rise, the world watches how two of the largest democracies navigate this high-stakes geopolitical standoff.


India Defends Its Energy Security Amid Tariff Onslaught

India has made it clear: national interests and energy security will not be compromised under pressure, even from long-time strategic partners. Following the tariff hike, Indian officials swiftly condemned the action as “unfair, unjustified, and unreasonable,” arguing that the country’s crude oil imports from Russia are purely economic in nature and essential for energy access to over 1.4 billion citizens.

Prime Minister Modi addressing media after Trump’s tariff escalation – “India will stand firm for its farmers, workers, and sovereignty.”

While the U.S. aims to punish nations for engaging with Moscow amid the prolonged Ukraine war, India contends that its non-aligned foreign policy and energy needs do not fall under the purview of unilateral American trade penalties. Prime Minister Narendra Modi, addressing domestic constituencies, affirmed that his government “will not compromise on the interests of farmers, fishermen, and dairy workers.” The statement reflects not just economic concerns but a deep-rooted political positioning ahead of domestic elections.

Moreover, Modi reinforced his commitment to the ‘Make in India’ initiative, urging businesses to treat this setback as a rallying call for self-reliance and internal growth. The government appears determined to signal strength both to domestic audiences and global investors—positioning itself as neither a pawn in U.S.-Russia dynamics nor a nation that can be economically bullied.


What’s Behind the Tariff Drama: Russia, BRICS, and Geopolitical Shifts

The current trade conflict is not merely about oil. The deeper tension lies in India’s growing closeness to the BRICS alliance—especially Russia and China—which Trump’s administration perceives as a challenge to U.S. global influence.

India, while technically neutral, has deepened its energy ties with Moscow since the start of the Ukraine war. In fact, India is now one of the top buyers of discounted Russian crude, re-routing what was once Western supply into its domestic fuel ecosystem. This decision, though rational from a pricing standpoint, has raised eyebrows in Washington.


Oil tanker arriving at a Gujarat port—Russian crude remains central to India’s energy basket in 2025.

According to White House officials, India’s “strategic ambiguity” on Russia no longer aligns with the expectations of a security and trade partner. Trump’s tariff escalation, first with 25% and now with an additional 25%, is seen as a direct attempt to economically pressure India into compliance.

However, India’s growing presence in global South alliances like BRICS+, its strategic port ties in the Indian Ocean, and energy independence drives have shifted its priorities. Many Indian analysts argue that these tariffs reflect a “fraying of the Modi–Trump bromance”, once seen as a strong counterweight to China’s rise.

The fallout is also diplomatic. Senior U.S. officials recently commented that “some differences with India may not be resolved overnight,” hinting at a long road ahead in mending fences. On the Indian side, diplomats are said to be in active talks with European and Asian allies to mitigate potential export losses to the U.S. market.


Markets React with Caution, but Optimism Persists

India’s equity markets opened on a cautious note following Trump’s tariff announcement. While the initial reaction showed a minor dip across Nifty and Sensex indices, seasoned investors remained largely unfazed, seeing the move as a “short-term headwind, not a structural disruption.”

According to data from Moneycontrol and Reuters, the sectors most vulnerable to U.S. tariffs include textiles, automotive parts, and consumer electronics. Fortunately, pharma and IT services—India’s major U.S.-facing exports—have so far remained exempt. This has provided a cushion against widespread panic.

Financial experts suggest that India may witness a 0.9% GDP erosion over the next 12–18 months if the tariffs stay in place. However, some believe this will be offset by rising intra-Asia trade and an internal consumption push fueled by Modi’s industrial policies.

Insert Relevant Image Here
Caption: Stock traders in Mumbai keeping a close eye on tariff-triggered volatility in Indian markets.

Investor sentiment also leans optimistic because the full 50% tariff will roll out in two phases—the first 25% from August 7 and the additional 25% by late August. This phased approach leaves a window for bilateral backchannel negotiations or policy reversals, should geopolitical dynamics shift.

Global investment firms like Morgan Stanley and CLSA have advised clients to “buy the dip,” citing India’s strong macroeconomic fundamentals, healthy forex reserves, and digital economy resilience as key buffers. The prevailing mood in Dalal Street is cautious but far from bearish.


What Lies Ahead: Diplomacy, Alternatives, and Strategic Autonomy

The road ahead for India–U.S. relations is fraught with complexities. But both nations understand that long-term cooperation outweighs short-term confrontation. The question remains: who will blink first?

India, for its part, is exploring countermeasures, including reviewing some of its own tariff barriers and seeking preferential access to ASEAN and European markets. The government is also considering ramping up domestic substitutes for goods that may be affected by U.S. import curbs.

Meanwhile, some strategic thinkers are advocating for a temporary recalibration of U.S.–India relations. A senior foreign policy expert noted, “Both sides need to recognize the moment. This is a test of strategic maturity, not a trade war to escalate further.”

On the diplomatic front, talks are reportedly underway between Indian and U.S. trade representatives. However, political posturing on both sides could delay resolution until after the U.S. elections or India’s own political season.

With rising oil prices globally and increased BRICS alignment, India may continue its Russian engagement in the short run. Yet, it will also look to diversify energy sources, including partnerships with Gulf nations, renewables, and African suppliers.

In the longer term, India aims to reduce external vulnerabilities through enhanced energy independence, stronger domestic manufacturing, and robust digital export sectors—all of which may eventually reduce its reliance on traditional Western markets.


Conclusion: Navigating the Storm with Strategic Balance

This latest tariff showdown is a wake-up call for both Washington and New Delhi. While the U.S. aims to weaponize trade as a foreign policy tool, India is asserting its right to strategic autonomy in a multipolar world. The tension underscores the fragile balance between economic pragmatism and geopolitical alignment.

For businesses, investors, and citizens on both sides, the hope lies in mature diplomacy and the realization that both countries have more to gain as allies than adversaries. The coming weeks will be critical in defining not just the future of trade, but the very character of India–U.S. relations in a rapidly changing world order.


Disclaimer:

This article is based on publicly available information and expert commentary as of August 7, 2025. The situation remains fluid, and readers are advised to follow official government and trade channels for real-time updates.

Top 50 Crypto Coins

Bitcoin Faces Make-or-Break Moment: Will Bulls Break Free or Bears Take Over?

5

Introduction

Bitcoin, the world’s largest cryptocurrency by market capitalization, is currently trading at a critical juncture. Technical indicators suggest a tight consolidation phase near key resistance levels, setting the stage for either a powerful breakout or a sharp fakeout. With Bollinger Bands tightening and price flirting with the upper band, traders are on high alert for the next big move. The daily chart analysis indicates a period of low volatility might soon give way to heightened action—bringing both opportunity and risk.


Bollinger Bands Squeeze Signals a Volatile Move Ahead

The Bollinger Bands indicator, widely used by technical traders to gauge volatility and potential breakouts, is showing signs of compression on the BTC/USD daily chart. Historically, when the bands squeeze, it signals a buildup of pressure—often followed by an explosive move in either direction.

Daily BTC/USD chart showing Bollinger Bands squeeze and resistance zone testing.

In the current scenario, Bitcoin is consolidating between the $57,800 to $59,200 range, hovering just below a crucial resistance trendline drawn from the last major swing high. The Bollinger Bands have narrowed significantly, and the price is hovering at the upper band, indicating bullish attempts to break out.

However, fakeouts are common during such setups, especially when low volume accompanies an upward thrust. Traders remember similar conditions in previous cycles—particularly in 2021—when Bitcoin faked a breakout before plunging into a mini correction.

Volume confirmation remains the key. If Bitcoin breaches above the resistance line with significant trading volume, the breakout could be genuine, pushing prices above $60,000. However, failure to sustain momentum could lead to a quick rejection and a fall back to the $56,000–$55,500 support zone.


Breakout or Fakeout? Traders Remain Cautiously Optimistic

The crypto market thrives on speculation, and Bitcoin is its pulse. With technical setups aligning for a possible directional move, the bulls and bears are in a state of strategic waiting. The recent candle formations near the resistance suggest indecision—wicks at the top of the candles reflect rejection at higher levels, while long lower wicks show buying interest at dips.

One veteran trader, known as @CryptoSurge on X (formerly Twitter), commented:

“This is textbook Bollinger squeeze behavior. If the breakout doesn’t come in the next 2-3 sessions, we might witness a liquidity grab followed by a violent pullback.”

This sentiment is echoed across many trading forums. The RSI (Relative Strength Index) is hovering near neutral territory (50–55 range), providing no clear bias. MACD lines are converging, but not yet offering a confirmed bullish crossover.

In simpler terms: the setup is ripe, but confirmation is key. Long-term investors may hold through the noise, but short-term traders are better off waiting for a candle close above the $59,500–$60,000 zone with strong volume and a bullish RSI divergence.

Historically, such setups have led to either:

  • A clean breakout followed by a $3,000–$5,000 rally
  • A fakeout above resistance followed by a swift drop of 5–7%

With altcoins also showing mixed signals, Bitcoin’s next move will likely set the tone for the broader crypto market in the coming days.


Market Sentiment and Macro Factors Driving BTC Price

While technicals dominate day-to-day charts, the broader sentiment and macroeconomic conditions continue to influence Bitcoin’s price trajectory. August 2025 has so far seen a cautious tone in the markets, with the U.S. Federal Reserve maintaining its hawkish stance on interest rates. Inflation numbers, though under control, still keep the market on edge.

Bitcoin’s correlation with the NASDAQ and tech stocks also plays a role. A strong equity rally may aid BTC’s breakout attempts. Conversely, any equity market correction could drag BTC lower, regardless of technical signals.

Moreover, ETF inflows have been inconsistent in recent weeks. Analysts at CryptoQuant pointed out that:

“Bitcoin ETFs have seen reduced inflows, signaling institutional hesitation at current levels. This may limit upside until macro clarity emerges.”

Additionally, on-chain metrics show decreasing exchange reserves, indicating that long-term holders continue accumulating. This is a positive sign for the longer-term price action, but short-term uncertainty remains.


What’s Next for Bitcoin? A Key Week for Directional Confirmation

The coming week is critical for Bitcoin. Whether it finally breaks above the $60,000 psychological barrier or retreats to test lower supports will likely depend on two key elements: volume and macro news catalysts.

If bulls manage to push prices past the resistance zone with strength, the next targets lie at $62,800 and then $65,000. This would rekindle the bullish narrative and may pull altcoins along for the ride.

However, a failed attempt could see Bitcoin fall to $55,500, with a worst-case scenario of testing the 200-day moving average near $52,000. Traders must remain alert to signs like:

  • Sudden spikes in volume
  • RSI crossing 60–65
  • MACD confirmation
  • News-driven volatility (e.g., Fed updates, geopolitical events)

Long-term HODLers need not panic unless BTC breaks the major trendline support below $50,000. For short-term traders, risk management is essential during such uncertain setups.


Final Thoughts: Volatility Ahead, Strategy is Key

Bitcoin is standing at a fork in the road. With technicals flashing warning signs and opportunity alike, the smart approach is to wait for clear confirmation before taking a position. Breakouts without volume often trap traders, while confirmed moves can deliver significant gains.

With the Bollinger Bands compressed, price action near resistance, and global markets in flux, Bitcoin’s next 7–10 days could shape the tone for the rest of Q3 2025.

Whether it’s a fakeout or a true breakout—stay alert, manage risk, and follow the charts, not the noise.


Disclaimer:

This article is for informational purposes only and should not be considered financial advice. Cryptocurrency trading involves high risk. Please consult a financial advisor before making any investment decisions.

Dow Jones Wobbles Near 44,100: Bounce or Breakdown After Mid-Bollinger Band Retest?

Dow Jones Wobbles Near 44,100: Bounce or Breakdown After Mid-Bollinger Band Retest?

10

Introduction:

The Dow Jones Industrial Average (DJIA) continues to trade under pressure, closing at 44,098.49, down 13.25 points (-0.03%), and testing the crucial 20-day SMA/Bollinger Band midpoint at 44,402.67. The index recently experienced a breakdown from a short-term range and is now struggling to regain bullish momentum. As the global equity rally pauses, investors are closely watching whether the Dow will bounce from its current zone or roll over for a deeper correction.


Price Action Analysis: Reversal Pattern or Minor Pullback?

“Dow Jones index showing signs of weakness after a failed breakout, hovering near Bollinger mid-band.”

The Dow had earlier seen a strong uptrend in June, rallying from 42,000 to above 45,000, but now faces resistance near 45,076.99—an area that aligns with the upper Bollinger Band and historical supply zone.

The daily chart clearly shows:

  • A breakout from a rectangle range in late June.
  • A quick rally, followed by a failed retest and sharp decline last week.
  • Price dipping below the 20 SMA (Bollinger midline) and now attempting to reclaim it.

This breakdown-retest setup is technically bearish unless bulls manage a strong close above 44,400–44,600 soon. If not, the pattern may play out into a rounded top formation, leading to lower lows toward 43,200 and 42,000.

Volume is slightly above average on the recent red candles, confirming distribution.


Bollinger Band Clues: Compression Followed by Volatility

The Bollinger Bands (BB 20 SMA) provide key clues:

  • Upper Band: 45,061.95
  • Mid-Band (20-day SMA): 44,402.67
  • Lower Band: 43,743.40

After a period of band compression in June, the Dow exploded upward—but has now returned to retest the breakout zone. This “volatility squeeze followed by expansion” is typical before trend reversals or accelerations. With price closing below the mid-band and struggling to climb above it, the setup now favors the bears.

However, the lower band is not far at 43,743. A bounce from this region is still technically possible and may keep the short-term uptrend alive—but bulls must defend it swiftly.


Horizontal Levels: Reversal or Continuation Zone

The chart shows two major consolidation ranges in the past few months:

  1. Late April–Early June Range: Between 41,900 and 42,900
  2. Mid-June–Mid-July Range: Between 43,600 and 44,800

The breakout above the second range initially seemed strong, but the recent pullback shows the market may be testing the validity of that breakout.

Currently, the price is right back in that range. A strong daily close below 43,743 would invalidate the earlier breakout and confirm a bull trap, opening the door for deeper losses toward 42,900.

However, a bounce from the current level and reclaim of 44,800 would signal strength and could pave the way for another leg up toward 45,500–46,000.


Fundamental Headwinds: Fed, Yields & Global Cues Weigh

While the technical structure weakens, macro headwinds are not helping either:

  • U.S. Treasury yields have risen, pressuring equity valuations.
  • Fed officials have maintained a cautious tone despite inflation progress.
  • Earnings season has been mixed, with mega caps outperforming but small/mid caps struggling.
  • Geopolitical concerns in Asia and Middle East continue to affect risk sentiment.

These fundamental concerns have contributed to the Dow’s hesitation at higher levels. Notably, the Nasdaq and S&P 500 have held stronger, indicating that industrial and cyclical stocks (dominant in the Dow) are under heavier pressure due to slowing global growth outlooks.


Outlook Ahead: Levels to Watch for Traders and Investors

Key levels from the current chart setup:

ZoneLevelAction/Significance
Upper Resistance45,076.99Major resistance / supply zone
Mid-Resistance44,800Previous breakout level
Current Mid-Line44,402.67Bollinger mid-point / 20-day SMA
Immediate Support43,743.40Bollinger lower band
Breakdown Trigger43,600Bearish confirmation
Major Support42,000April-May base level

Conclusion: Dow at Decision Point Amid Tight Macro & Technical Pressure

The Dow Jones is at a technical crossroads—a bounce from current levels could reignite the uptrend, while failure to hold above the lower Bollinger Band near 43,743 would confirm a bearish reversal pattern. The next few sessions will be critical.

Aggressive traders can consider short positions below 43,600 with tight stops, while swing traders may wait for a decisive move above 44,800 to reenter long.

Either way, risk management is key. With Fed uncertainty, rising yields, and slowing growth, volatility is expected to remain elevated.


Disclaimer:

This article is for informational and educational purposes only. It does not constitute financial or investment advice. Please consult with a certified financial advisor before making any trading or investment decisions.


Nifty 50 Hovers Near Key Support: Will Bulls Defend 24,456 or Capitulate Further?

Nifty 50 Hovers Near Key Support: Will Bulls Defend 24,456 or Capitulate Further?

10

Introduction:

India’s benchmark index, the Nifty 50, continues to hover near a key support level at 24,456, showing signs of weakening momentum amid broader global and domestic uncertainties. The index has now dropped to 24,574.20, registering a loss of 75.35 points (-0.31%) in the latest session. With price action sticking close to the lower Bollinger Band, traders are asking—will this be a short-term consolidation or a breakdown signaling deeper correction?


Weakness Persists as Nifty Nears Lower Bollinger Band and Crucial Support

Nifty’s recent performance shows a steady decline from its July highs, with the price now struggling to stay above the 24,456 support line. The daily chart highlights a classic breakdown structure, where a series of lower highs and lower lows are forming. The index is also trading below the mid-Bollinger Band (20-day SMA) set at 24,949.15, showing that the momentum remains under bearish control.

“Nifty 50 chart shows prolonged downtrend and test of 24,456 support zone with bearish volume.”

This pattern suggests sustained selling pressure, especially as the candles consistently close near or below the lower Bollinger Band. The volatility is expanding, as evident from the widening bands, which often precedes sharp directional moves. With volume spikes on red candles and lower volume on green ones, the bias appears firmly tilted in favor of the bears.

If this support fails to hold in the upcoming sessions, the next visible downside target lies at 23,224—a level last seen in May and backed by high-volume accumulation. On the upside, Nifty must reclaim 24,949 and then 25,411 to reestablish bullish confidence.


Mid-Term Outlook: Breakdown from Consolidation Signals Trend Weakening

The Nifty 50 had previously formed a consolidation zone between 24,950 and 25,641 from mid-June to mid-July. This range provided a cushion for bulls during periods of selling pressure. However, in the last two weeks of July, the index broke below this zone with conviction, supported by increased volume, and has since failed to re-enter the upper half of the Bollinger Band.

This kind of breakdown usually signals a shift in market sentiment from bullish to neutral or even bearish. As per technical patterns, breakdowns from such horizontal consolidations often lead to measured moves equivalent to the width of the range—in this case, around 700–800 points—which suggests the index could slide below 24,000 if current levels don’t hold.

Another concerning signal is the inability of the index to rebound despite broader market cues. Global equities like the Dow Jones and S&P 500 saw brief relief rallies, but Nifty has continued to grind lower, indicating domestic concerns weighing heavier on investor sentiment.

This includes:

  • Persistent FII outflows amid rising U.S. bond yields.
  • Weak earnings from mid-cap and banking names.
  • Policy uncertainty ahead of state elections.
  • Inflationary pressure due to monsoon irregularities.

Analysts also highlight that Nifty’s RSI is nearing oversold territory, currently hovering near 32–35 levels. While this doesn’t guarantee a reversal, it indicates that a technical bounce could be expected if macro conditions stabilize.


Sectoral Drag: IT, Banks, and FMCG Add to the Index Pressure

The Nifty’s decline is not just technical—it’s sectorally broad-based. Nifty Bank and Nifty IT, two heavy-weight contributors, have both seen increased selling. While private banks like HDFC Bank and ICICI Bank are holding ground, PSU banks have seen stronger declines. Similarly, top IT names like Infosys and Wipro are facing margin pressure, disappointing investors with subdued quarterly guidance.

FMCG, which had earlier supported the index during periods of volatility, is now also faltering due to input cost concerns and muted rural demand recovery. Even high-beta sectors like Auto and Realty are showing signs of exhaustion.

As a result, the overall market breadth has narrowed significantly. The Advance/Decline ratio on the NSE is turning negative, signaling growing bearish sentiment across the broader markets.

Brokerages like Motilal Oswal and Kotak Securities have revised their near-term Nifty outlook from “sideways bullish” to “watchful bearish,” suggesting traders reduce leverage or stay defensive until the index finds a reliable base.


Will 24,456 Act as the Final Line of Defense Before Panic Sets In?

The 24,456 level, highlighted on the chart, aligns with a previous gap zone formed in early June—a region that had seen strong buying interest. This makes it a psychological and technical pivot. If the bulls manage to hold this support and push Nifty back above 24,800, we could see a short-term rally toward 25,200–25,400. However, the setup remains fragile.

If the support fails, a flood of stop-losses and algorithmic selling may accelerate the decline, dragging the index quickly toward the lower targets at 24,200 and 23,224. Traders should look for high-volume bullish candles to confirm any reversal, else stay on the sidelines or consider short trades with tight risk management.

The Bollinger Band lower curve is currently at 24,486. A daily close significantly below this level would indicate a continuation of the current downtrend.

On the flip side, if the index shows strength and reclaims the mid-band at 24,949 with a bullish engulfing pattern, it could signal a near-term bottom and a possible bounce back above 25,400.


Conclusion: Nifty’s Tipping Point – Breakdown or Bounce Ahead?

The Nifty 50 index stands at a delicate crossroads. Technical patterns, volume data, and broader sectoral weakness point to increasing pressure on the 24,456 support. While this level has historically acted as a strong bounce zone, the lack of positive catalysts makes its sustainability questionable.

Investors and traders should keep a close eye on daily candle formations, macroeconomic news (especially inflation data and FII flows), and global cues from the U.S. and China. Until Nifty shows signs of a convincing reversal, short-term sentiment is likely to remain bearish.

For now, bulls need to protect 24,456 at all costs—or risk a slide into a deeper correction zone that could test 23,000 and below in the coming weeks.


Disclaimer:

This content is meant for educational and informational purposes only. It is not investment advice. Please consult your financial advisor or do your own research before making any investment decisions. The stock market is subject to risks.


Bitcoin Drops Below Key Resistance: Will $112K Hold or Break Further?

Dow Jones Faces Key Test Near 44,200: Rebound or More Downside Ahead?

26

Introduction:

The Dow Jones Industrial Average (DJIA) is navigating a critical juncture as the index hovers around the 44,200 mark, showing signs of recovery after a sharp decline. With price movements now fluctuating near the middle Bollinger Band and important support-resistance levels, traders are watching closely for a decisive breakout or breakdown. The market’s next move could determine whether the recent dip was a temporary correction or the beginning of a deeper retracement.


Dow’s Mid-Bollinger Recovery Suggests Cautious Optimism

The Dow Jones saw a volatile trading session this week, bouncing back after falling below the lower Bollinger Band—a move typically seen as a signal of a possible price reversal or temporary relief rally. The index touched a low near 43,923 before recovering to 44,224. This recovery brings the Dow closer to the 20-day simple moving average (SMA) currently at 44,426, which now acts as immediate resistance.

“Dow Jones daily chart shows bounce from lower Bollinger Band support with current resistance near 44,426.”

This technical development could point toward short-term stabilization. The Bollinger Bands, which had widened significantly during the drop, are now beginning to compress—a common precursor to consolidation or a trend reversal. However, for a convincing bullish move, the index must sustain above 44,426 and ultimately reclaim the upper resistance at 45,061.

The candle formed after the steep drop suggests demand at lower levels, but the lack of high volume on the rebound may indicate a lack of strong conviction from buyers. The bulls will need to follow through in the next few sessions to shift sentiment in their favor.


Key Support Zones and Resistance Levels to Watch Closely

The Dow is now facing a narrow battle zone: support near 43,790 and resistance at 44,426. These levels are critical not just for intraday or swing traders but also for institutions managing risk amid earnings season and macroeconomic data releases.

During the sharp decline seen in late July, the Dow broke below the key consolidation range that had held for most of June and July. This range, between roughly 44,200 and 45,000, had acted as a base before the sharp July rally. The breakdown below this zone led to a fast drop, testing support near 43,000 before recovering.

Interestingly, the index bounced near the lower Bollinger Band, which has acted as dynamic support over recent months. This aligns with previous technical behavior, where touching the lower band has often triggered a short-term mean reversion.

However, a key concern is the mid-band resistance. Historically, after such sharp drops, if the price fails to move above the 20-SMA line (currently at 44,426), it often signals a continuation of the bearish trend. A failure to reclaim this level in the next 2–3 sessions could send the Dow back toward the lower band near 43,790 or even 43,000.


Macro Drivers: Fed Policy, Inflation, and Earnings Pressure

While technical indicators provide the framework, macro fundamentals continue to shape the market’s mood. The U.S. Federal Reserve’s tone has turned more hawkish than expected in recent speeches, with comments hinting that interest rates may stay elevated well into 2026 due to persistent core inflation.

Rising bond yields are also taking their toll on equities. The 10-year Treasury yield climbed above 4.4%, reducing the appeal of riskier assets like equities. Investors are starting to price in “higher for longer” interest rate conditions, which negatively affect growth stocks and indexes like the Dow.

Earnings season is also proving to be a mixed bag. While tech giants have delivered strong numbers, several Dow components in industrials, energy, and consumer sectors have missed estimates or provided weak forward guidance. This drag has added pressure to an already jittery market.

According to JPMorgan’s recent note, “The market is moving from a liquidity-driven rally to a fundamentals-based reality check. The Dow’s movement reflects investor concern about valuations, growth momentum, and Fed policy misalignment.”


Near-Term Outlook: Will Dow Break Above 44,426 or Slide Again?

As the index moves sideways near 44,224, traders are split between two outcomes: a bullish breakout above the mid-Bollinger band (44,426) or a rejection and pullback toward the 43,000 zone. This indecision is typical of markets in transition—either preparing for a new leg higher or deeper correction.

If bulls manage to push above the 44,426 resistance and sustain it, the next target becomes 45,061.87, followed by a potential move toward the July high of 45,076.99. However, failure to do so might lead to a retest of 43,790, and if broken, 43,000 will be the next area of interest.

Traders using Bollinger Band strategies should note:

  • The squeeze is tightening, suggesting a larger move could be coming.
  • A break below the lower band could accelerate losses.
  • A strong close above the mid-band may confirm a reversal.

Indicators like RSI and MACD are currently neutral to slightly bearish, further reinforcing the need for caution in both long and short positions. Volume also remains low on the rebound, so a breakout must be supported by strong participation to be sustainable.


Conclusion: Dow Faces Crucial Week as Bulls and Bears Battle

The Dow Jones Industrial Average is at a make-or-break level. As the index attempts to rebound from last week’s correction, all eyes are on the 44,426 resistance and the 43,790 support. These levels could determine whether the recent dip was a healthy correction or the start of a bearish trend.

With macro uncertainty looming and technical signals mixed, this week will be critical for Dow traders. Breakouts or breakdowns from this tight range will likely set the tone for the rest of August and perhaps the quarter ahead.

Short-term traders should watch for volume confirmation, reaction near the Bollinger Band mid-line, and broader sentiment driven by economic data and Fed commentary. Long-term investors may consider this volatility as part of the normal cycle, but timing entries remains crucial.

Whether the Dow reclaims lost ground or succumbs to bearish pressure, one thing is certain—the market is preparing for a move, and traders would do well to stay alert.


Disclaimer:

This article is for educational and informational purposes only. It should not be considered financial advice. Trading and investing in financial markets involves risk. Always do your own research or consult with a financial advisor before making any investment decisions.

Bitcoin Drops Below Key Resistance: Will $112K Hold or Break Further?

Bitcoin Drops Below Key Resistance: Will $112K Hold or Break Further?

10

Introduction:

Bitcoin (BTC) is under pressure again, as recent daily charts signal a breakdown below a key resistance level near $116,000. With the price now hovering around $112,748, traders and investors are watching closely for the next major move. The Bollinger Bands are tightening, volatility is contracting, and the bulls have failed to reclaim the crucial mid-band resistance. Is this a healthy retracement or the start of a larger correction?


Bearish Rejection at Mid-Bollinger Band Indicates Selling Pressure

Bitcoin attempted to bounce back from recent lows, but its efforts were cut short at the $116,000 mark. This level, which coincides with the 20-day simple moving average (SMA) of the Bollinger Bands, acted as a strong resistance. The failure to break through this line suggests that sellers still dominate the market.

“Bitcoin daily chart showing rejection at mid-Bollinger band and breakdown below support.”

This rejection, coupled with the red candlestick seen in the latest session, confirms a bearish outlook in the short term. The Bollinger Bands are beginning to squeeze—a classic sign that a volatile move could be imminent. Currently, the price is trapped between a lower support at approximately $112,000 and the mid-band resistance at $116,976.

Analysts point out that if Bitcoin fails to hold the $112,500 zone, it may trigger a deeper slide toward the lower Bollinger Band, which currently hovers near $108,000. This scenario could further extend to psychological support near $105,000, especially if macroeconomic or regulatory news continues to pressure risk assets.


The Importance of $112K: Historical Support Now in Focus

In the past, the $112,000 level has acted as a bounce zone for Bitcoin, providing temporary relief during minor corrections. However, this time around, the support is being tested under more stressful technical conditions.

Over the last two weeks, BTC/USD has formed a lower high structure—a classic bearish indicator. The 20-SMA, which once supported the uptrend in July, has now flipped into resistance. Traders also point out that the current chart shows a classic “lower high and lower low” structure developing, confirming short-term weakness.

The breakdown from the mini-range ($116,000–$121,000) that lasted for nearly two weeks in late July has also put bulls on the defensive. Without a convincing reclaim of $116,000 in the coming sessions, buyers may remain cautious.

Volume analysis shows weakening bullish momentum. A breakout in early July saw a strong green candle supported by high volume, but current candles—both green and red—show reduced volume, suggesting waning interest or uncertainty among traders.


Macro Factors and Market Sentiment Dragging Bitcoin Lower

Beyond the chart, global macroeconomic factors are contributing to Bitcoin’s slide. The U.S. dollar has strengthened in recent sessions amid signs that the Federal Reserve may delay any interest rate cuts until Q1 2026. A stronger dollar typically pressures Bitcoin, which is seen as a hedge against fiat currency devaluation.

Furthermore, ongoing concerns about crypto regulation, particularly in the U.S., continue to create uncertainty. The recent rejection of multiple Bitcoin ETF applications by the SEC has also dampened sentiment.

Analyst Karen Mulrooney of CryptoMarketSignals stated, “We’re seeing a risk-off environment return. Equity markets are jittery, and Bitcoin is being treated more like a tech stock right now than digital gold. Unless Bitcoin finds fresh institutional demand or a macro catalyst, support zones like $108K or even $105K might be tested.”

Fear & Greed Index for crypto also dipped to 38 (Fear) from last week’s 51 (Neutral), signaling increased investor anxiety. This further aligns with the rejection at resistance, suggesting more pain could lie ahead if sentiment continues to deteriorate.


Outlook: Will Bitcoin Hold $112K or Crash Towards $105K?

The immediate focus remains on the $112,000–$112,500 support zone. If Bitcoin holds above this level and rebounds strongly, it could indicate a false breakdown and invite aggressive dip-buying. However, if sellers breach this level, the next support lies around $108,000 (lower Bollinger Band), followed by $105,000 (psychological level and June consolidation base).

Long-term investors may view this as an opportunity, but short-term traders should remain cautious. A decisive close below $112K could trigger further stop-loss cascades and panic selling.

Technical indicators also point to bearish momentum:

  • RSI is trending downward but has not yet entered the oversold zone, suggesting more room for downside.
  • MACD is showing a bearish crossover, reinforcing short-term weakness.
  • Bollinger Band squeeze may lead to a sharp breakout or breakdown—currently favoring the latter.

For Bitcoin to resume its upward trend, a strong bullish close above $116,976 (mid-Bollinger Band) followed by a reclaim of $121,000 would be required. Until then, the short-term trend remains bearish.


Disclaimer:

This article is for informational purposes only and should not be considered financial or investment advice. Cryptocurrency investments are highly volatile and involve risk. Please conduct your own research or consult a professional before making investment decisions.

Top 50 Crypto Currencies

Tesla’s Board Faces Crossroads as Elon Musk’s $56B Pay Deal Spurs Market Jitters and Shareholder Debate

14

Introduction
Tesla Inc. finds itself at the center of global financial scrutiny as the automaker’s board and shareholders navigate the aftermath of a controversial $56 billion compensation package for CEO Elon Musk. Amid volatile market reactions, governance challenges, and investor unease, questions are rising about leadership, accountability, and the future direction of one of the world’s most influential technology companies. As regulatory frameworks tighten and Tesla’s competition intensifies, the timing of this development could shape not just Tesla’s stock trajectory—but its legacy.


Elon Musk’s $56 Billion Payday: Ambition, Performance, and Controversy

Tesla’s historic compensation plan for Elon Musk, originally approved in 2018, is back under the spotlight after being legally challenged and scrutinized by courts and investors alike. The deal—once heralded as a bold move to align leadership vision with shareholder return—is now under fire for its sheer scale and lack of traditional corporate oversight.

Elon Musk addressing Tesla shareholders during the company’s annual general meeting.

Designed around ambitious performance milestones such as market cap growth, revenue targets, and sustained profitability, the package granted Musk stock options tied to 12 specific goals. While Musk did hit many of these targets—helping Tesla surpass a $1 trillion valuation at its peak—critics argue that the board gave him too much latitude, lacking adequate checks and balances.

As of August 2025, with Tesla stock facing renewed volatility and increased scrutiny from both regulators and investors, the massive payout—representing the largest compensation plan in corporate history—is being re-evaluated. A Delaware judge ruled the original plan invalid earlier this year, citing flawed governance and conflicts of interest within the board. Tesla is now reportedly working on a revised package, sparking both market uncertainty and ethical debate.


Investor Sentiment Splits as Stock Fluctuates

Musk’s compensation saga has significantly impacted Tesla’s stock dynamics. In the days following the board’s reaffirmation of support for Musk’s revised package, Tesla shares saw a rollercoaster of trading activity, reflecting both confidence in Musk’s long-term vision and anxiety over corporate governance.

At the heart of the issue is how investors perceive value versus risk. While Musk’s leadership has undeniably driven Tesla’s global expansion—from its Austin gigafactory to its AI-driven self-driving initiatives—some institutional shareholders express concerns about overconcentration of power and the precedent it sets for executive pay.

Tesla’s board, for its part, argues that Musk’s ability to innovate and scale the company justifies the package. They cite his role in expanding production facilities, driving EV market leadership, and pushing technological boundaries across solar, battery, and AI verticals. Retail investors remain divided. Some see Musk as a once-in-a-generation visionary who deserves every cent; others worry the board is too closely aligned with his interests, undermining independence.

Meanwhile, Tesla faces growing competition from Chinese EV players like BYD and global auto giants like Ford and GM who are ramping up their electric vehicle investments—putting even more pressure on Musk to deliver continued growth under increasingly scrutinized leadership.


Legal and Regulatory Ramifications: Setting a Precedent?

The legal battle over Musk’s pay package could have ripple effects across U.S. corporate law. The Delaware Court of Chancery’s ruling in early 2025 was a wake-up call to public companies: even visionary founders are not above fiduciary responsibility and procedural fairness.

The case highlighted how Tesla’s board—composed of longtime friends, former family members, and loyalists—allegedly lacked true independence when crafting the pay plan. Legal experts say this could become a benchmark case for executive compensation policy, forcing companies to ensure more transparency, shareholder input, and external evaluation in board decisions.

The Securities and Exchange Commission (SEC) is also reportedly observing the situation closely. While no formal investigation has been announced, the commission may push for broader disclosure norms for future performance-based incentives, especially for founder-led firms.

Corporate governance watchdogs suggest this case could lead to tighter requirements for board composition, executive pay disclosure, and shareholder rights. If so, Tesla may become a turning point not just for the EV industry—but for corporate America as a whole.


What’s at Stake for Tesla’s Innovation Roadmap?

Despite the controversy, Tesla continues to push forward with aggressive growth plans. The company’s AI-driven robotaxi initiative, continued expansion into energy storage, and rumored developments around humanoid robotics suggest Musk is not slowing down. However, leadership distraction and shareholder rifts could undermine execution if not managed effectively.

In recent investor calls, Musk has emphasized the importance of remaining focused on the mission—accelerating the world’s transition to sustainable energy. He warned that governance debates could “distract from what matters most: innovation and delivery.”

Tesla is currently constructing its sixth gigafactory in India, a major move into the world’s most populous nation. Meanwhile, partnerships with energy providers and governments across Europe, Latin America, and Southeast Asia hint at a broader strategy to become not just an automaker—but a global clean energy behemoth.

But these efforts require unity, agility, and stability—factors potentially at risk if internal and external stakeholders continue to clash over leadership legitimacy and board accountability.


The Road Ahead: Will Tesla Rewrite the Rules Again?

What happens next could reshape how companies balance innovation with governance. If Tesla’s revised plan is approved by courts and shareholders, it may reinforce founder-led companies’ ability to bypass conventional norms. If not, it could embolden investors to demand greater oversight and long-term accountability.

Musk’s role, too, may evolve. He has hinted at stepping back from day-to-day Tesla operations if disagreements with regulators persist—though few believe he would ever truly sever ties. Some investors hope that the company introduces a co-CEO or strengthens its executive bench to reduce reliance on a single personality.

Regardless of the outcome, Tesla’s leadership story is far from over. As markets evolve, competitors catch up, and governance models come under greater pressure, the company’s ability to maintain its innovation edge while satisfying shareholder expectations will define the next chapter.


Disclaimer:
This article reflects public developments and market sentiment as of August 2025. Any financial decisions should be made in consultation with a licensed advisor. All quotes are paraphrased based on public statements and reporting.

Joby Aviation Soars 21% After Blade Acquisition: Chart Breakout Signals Momentum for eVTOL Pioneer

Tata Motors CFO Appointed as New CEO of Jaguar Land Rover: A Strategic Shift for Global Leadership


Introduction

In a bold strategic move, Tata Motors has appointed its Chief Financial Officer, PB Balaji, as the new Chief Executive Officer of its UK-based luxury vehicle division, Jaguar Land Rover (JLR). This leadership transition reflects Tata’s growing intent to deepen integration across its global automotive operations and accelerate JLR’s transition toward electrification and profitability. The move signifies not just a personnel change but a pivotal shift in Tata Group’s global auto ambitions.


New Leadership Signals Strategic Realignment at JLR

Jaguar Land Rover’s leadership baton has passed from Adrian Mardell to PB Balaji, marking a significant transition in the company’s journey. Adrian Mardell, who served as CEO since 2023, will be stepping down effective immediately. PB Balaji, the Group CFO of Tata Motors, is widely known for his sharp financial acumen and ability to lead operational turnarounds.

Insert Relevant Image Here
Caption: PB Balaji (center), the new CEO of JLR, has served as CFO of Tata Motors since 2017.

Balaji’s appointment is not merely a promotion—it represents Tata’s plan to bring greater alignment between its India operations and its British luxury brand. According to Tata Motors’ official statement, this strategic shift is part of a broader initiative to “harness synergies across Tata’s automotive ecosystem and drive long-term value.”

JLR, known for its iconic brands such as Land Rover Defender and Jaguar F-Type, has faced fluctuating profits and chip shortages in recent years. However, under Mardell’s brief leadership, the company made a steady recovery in volumes and launched several electric vehicle initiatives. Balaji is now expected to steer JLR into a full-fledged EV transition, while also consolidating operational efficiencies with Tata Motors.


Balaji’s Proven Track Record and Vision for JLR

PB Balaji joined Tata Motors as Group CFO in 2017, bringing with him vast experience from Unilever and other global enterprises. Since then, he has led Tata Motors through various financial challenges, including debt restructuring and cost optimization initiatives. Under his financial leadership, Tata Motors turned from a loss-making entity to one of the most valuable auto stocks in India.

Jaguar Land Rover’s EV roadmap is expected to accelerate under Balaji’s leadership.

Balaji has been a key architect of Tata’s passenger EV revolution in India, including the success of models like the Nexon EV and Tiago EV. His strategic vision aligns perfectly with JLR’s “Reimagine” program—an ambitious roadmap to transform JLR into an electric-first luxury automaker by 2030. Industry insiders believe Balaji’s financial discipline combined with tech-driven foresight will fast-track this transition.

In recent remarks, Balaji expressed gratitude for the trust placed in him and acknowledged the challenges ahead, especially in navigating a volatile global EV market. Analysts expect him to focus on reducing dependency on China for components, enhancing supply chain resilience, and expanding JLR’s footprint in fast-growing regions like India and the Middle East.


Why Tata Motors Made This Move Now

The timing of the leadership change is telling. Tata Motors is preparing to launch Tata Technologies IPO and is also in the process of building EV-centric platforms for both domestic and international markets. Bringing Balaji to helm JLR could mean tighter synchronization of operations and innovation across the group.

In fact, many believe that JLR will play a pivotal role in Tata’s broader global EV ambition. With PB Balaji taking over, the India-UK synergy could become stronger. Tata Motors is already investing heavily in building battery gigafactories in the UK, with support from the British government. These factories will eventually supply JLR’s next-gen EVs.

Further, as JLR plans to unveil its first all-electric Range Rover in 2025, Balaji’s appointment is seen as an effort to ensure timely execution, better cost control, and sustainable profitability. His background in managing complex global portfolios will be critical as JLR navigates both regulatory challenges in Europe and rising competition from Tesla and Chinese EV brands.


Future Outlook: What to Expect from JLR Under New Leadership

Balaji’s appointment could mark the beginning of a new era for JLR—one rooted in innovation, sustainability, and integrated operations. With his dual understanding of Tata Motors’ strategy and global financial trends, he is well-positioned to optimize JLR’s performance.

Expectations are high. Analysts predict that JLR could hit its long-term EBITDA targets ahead of schedule under Balaji’s leadership. The company’s EV plans, including the Jaguar brand becoming all-electric by 2025, will likely get a sharper execution push. Integration of software-defined vehicles (SDVs), autonomous features, and AI-based in-car experiences could also become a focus.

Tata Sons Chairman N. Chandrasekaran, in a statement, reaffirmed that the leadership transition aligns with Tata’s “Vision 2025” of making its automotive units globally competitive and future-ready. With sustainability at the core and an electric-first vision, JLR’s next few years will be crucial—and Balaji now holds the wheel.


Disclaimer

This article is based on publicly available information as of August 4, 2025. The views expressed are for informational purposes only and do not constitute financial or investment advice.

Joby Aviation Soars 21% After Blade Acquisition: Chart Breakout Signals Momentum for eVTOL Pioneer

Joby Aviation Soars 21% After Blade Acquisition: Chart Breakout Signals Momentum for eVTOL Pioneer

11

Introduction:

Shares of Joby Aviation (NYSE: JOBY) surged over 21% on August 4, 2025, following the announcement of its strategic acquisition of Blade Air Mobility’s passenger business. This move not only enhances Joby’s market presence in the urban air mobility space but also triggered a significant technical breakout on the daily chart. With massive volume support and a confirmed bullish breakout, both investors and traders are turning their focus toward this eVTOL stock. Let’s dive into what this acquisition means, how the chart is shaping up, and what lies ahead for Joby.


Blade Acquisition: Joby’s Ticket to Urban Air Domination

The $125 million acquisition deal with Blade Air Mobility marks a major milestone for Joby Aviation. This strategic purchase includes Blade’s U.S. and European passenger operations, offering access to a premium customer base, 12 major urban terminals including high-traffic zones like JFK, Newark, and Southern Europe, and an experienced team that will continue to operate under Joby’s umbrella.

“Joby Aviation’s eVTOL aircraft preparing for next-gen urban air mobility.”

By acquiring an already profitable, branded air shuttle business, Joby avoids the hefty capital expenditure typically required to build such a network from scratch. The deal also includes a transition agreement where Blade’s CEO, Rob Wiesenthal, will continue to lead the passenger unit — ensuring operational continuity and strategic synergy. Furthermore, this move is expected to accelerate the adoption of eVTOL aircraft in cities like New York, where helicopter services can now be seamlessly upgraded to quieter, electric aviation under the Blade brand.

The timing couldn’t be better. Joby is progressing through its FAA certification process and is expected to launch commercial operations by 2026. The infrastructure and customer base acquired from Blade perfectly complement Joby’s roadmap, giving the company a first-mover advantage in the U.S. and European urban air mobility markets.


Technical Breakout Confirms Bullish Sentiment

The stock chart of Joby Aviation paints a powerful picture of investor enthusiasm. Prior to the acquisition announcement, JOBY had formed a consolidation range between $16.50 and $18.50, marked by horizontal support and resistance lines. This range-bound movement lasted nearly two weeks, reflecting a period of accumulation and uncertainty.

“Technical chart of Joby Aviation (NYSE: JOBY) showing the breakout above $18.50 resistance.”

On August 4th, JOBY broke through this resistance in spectacular fashion — closing the day at $20.79, up 21.15%, and backed by 54.14 million shares traded — significantly above its average volume. This breakout occurred alongside a strong bullish candlestick that engulfed the previous week’s price action, a classic sign of momentum and trend continuation.

Notably, the stock also pierced the upper Bollinger Band (at $20.98), a sign that the volatility is expanding upward. The 20-day SMA and 50-day SMA are both trending upward, reinforcing a solid uptrend. With the next psychological resistance level at $22 and then $25, technical traders are eyeing this setup as a potential breakout runner.

Adding to the bullish sentiment is the backdrop of macro support — growing investor appetite for sustainable tech, electric aviation, and infrastructure-light mobility services.


A Leap Toward the Future of eVTOL and Urban Mobility

Beyond the charts and dealmaking, this acquisition solidifies Joby Aviation’s position as a global eVTOL leader. While competitors are still testing prototypes or battling regulatory delays, Joby has capitalized on timing, credibility, and now — infrastructure.

The integration of Blade’s passenger business also accelerates Joby’s transition from pre-revenue startup to operational business. Blade’s reported $3.6 million in 2024 profit from the passenger division will begin contributing to Joby’s topline soon. Moreover, the continued partnership with Blade’s spun-off medical transport unit, now Strata Critical Medical, ensures cross-functional synergies in both commercial and critical operations.

This isn’t just about buying terminals and routes. It’s about gaining a foothold in urban air corridors that will define the next decade of mobility — corridors where air traffic, congestion, and noise regulations demand smarter solutions.

Furthermore, Joby’s proprietary ElevateOS platform, which will now be integrated into Blade’s existing systems, promises enhanced fleet scheduling, route optimization, and real-time operations — a level of automation that traditional rotorcraft providers can’t match.


Where Do We Go From Here? Outlook, Risks & Reward

From an investment standpoint, Joby Aviation’s risk-reward ratio has shifted significantly. The Blade acquisition adds real-world utility to what was previously seen as a futuristic concept stock. With its aircraft already undergoing Type Inspection Authorization flights and FAA certification tracking toward a 2026 launch, the revenue story is now more tangible than ever.

However, investors should remain aware of the risks. Regulatory delays, integration challenges, and rising competition from players like Archer Aviation, Lilium, and Vertical Aerospace could impact Joby’s timeline and market share. Additionally, while the current stock surge is exciting, profit-taking and volatility are common after such strong breakouts — making $20.00 to $18.50 a key support zone to watch.

Yet, if Joby executes well, it could dominate an industry projected to exceed $100 billion by 2040, according to Morgan Stanley research. With the infrastructure, customer base, aircraft technology, and now revenue channels aligned, Joby might well become the Tesla of the skies.


Disclaimer:

This article is for informational purposes only and should not be considered financial advice. Please consult a licensed financial advisor before making investment decisions.

Global News

Sri Lotus Developers IPO Opens: Key Details, UPI Mandate Deadline, Price Band, and Subscription Strategy

17

Introduction:

The much-awaited Initial Public Offering (IPO) of Sri Lotus Developers and Realty Limited (LOTUSDEV) opened for public subscription on July 30, 2025, and will close on August 1, 2025. With a fresh issue worth ₹7,920 million and anchor investor support already in place for over 1.57 crore shares, this real estate-focused IPO has garnered significant interest. Priced in a competitive range of ₹140 to ₹150 per share, the IPO aims to leverage India’s growing urbanization and real estate boom. Here’s an in-depth look into the offer details, application process using UPI/ASBA, and key takeaways for retail, QIB, and NII investors.


LOTUSDEV IPO: Price Band, Lot Size, and Category-Wise Details

The IPO is a 100% book building issue consisting entirely of a Fresh Issue. Notably, this IPO does not include an Offer for Sale (OFS), which signals that all proceeds will go toward business expansion, debt reduction, or operational needs—often seen as a positive sign by analysts.

Insert Relevant Image Here
Caption: LOTUSDEV IPO snapshot showing issue size, price range, and investor limits.

✅ Key Offer Details:

  • Issue Size: ₹7,920 million
  • Price Range: ₹140 to ₹150 per equity share
  • Discount: ₹14 per share for eligible employees
  • Face Value: ₹1 per equity share
  • Bid Lot: 100 shares and in multiples thereof
  • Minimum Order Quantity: 100 equity shares
  • Tick Size: Re.1

The IPO market timings are from 10:00 a.m. to 5:00 p.m., across all days of the subscription period.

✅ Category-Wise Application Limits:

  • Retail Investors: Max ₹2,00,000
  • Eligible Employees: Max ₹5,00,000
  • QIB Investors: Up to 3,95,00,000 shares (lower price band)
  • NII Investors: Up to 2,82,14,200 shares (lower price band)

Lead managers for the IPO are Monarch Networth Capital Limited and Motilal Oswal Investment Advisors Limited. KFin Technologies Limited is acting as the registrar.


Mandatory UPI-ASBA Based Application: SEBI Guidelines in Force

In line with SEBI’s mandate, all investors must apply through the ASBA (Application Supported by Blocked Amount) facility. For retail and employee investors, UPI-based payment is now mandatory.

🔔 Important Cut-Off:

  • UPI Mandate Deadline: August 1, 2025, 5:00 PM
  • Only applications where mandate status is “RC100” (funds blocked) before this cut-off will be valid.

🔑 SEBI Circular Reminder:

As per SEBI circular SEBI/HO/CFD/DIL2/CIR/P/2019/76, dated June 28, 2019:

“Intermediaries must retain physical application forms for six months (for UPI-based payments). However, for electronic forms, retaining printouts is not required. Electronic records should be maintained for at least 3 years.”

This ensures transparency, auditability, and a seamless digital trail.


Demand Outlook: Real Estate Momentum + Strong Anchor Backing

With a growing focus on Tier 1 and Tier 2 urban development, Sri Lotus Developers is well-positioned to ride the wave of real estate expansion in India. The real estate sector has witnessed a post-pandemic revival, driven by low interest rates, housing demand, and infrastructure projects.

Analysts are positive on the IPO’s timing, especially considering:

  • Full Fresh Issue (no promoter sell-off)
  • Strong Anchor Book allocation for 1.57 crore shares
  • Affordable price band and employee discount
  • Sector growth tailwinds in urban development and housing-

Investors may track subscription status in real-time on NSE/BSE IPO portals under the “Demand Graph” and “Bid Details” tabs.


Step-by-Step Guide: How to Apply for LOTUSDEV IPO Using UPI/ASBA

Here’s how you can invest in the LOTUSDEV IPO before the window closes:

✅ Through UPI-Linked Broker Platforms:

  1. Log in to your app (Zerodha, Groww, Upstox, Angel One, etc.)
  2. Go to IPO section → Select “LOTUSDEV IPO”
  3. Choose investor type: IND (Retail) or EMP (Eligible Employee)
  4. Enter number of lots (100 shares per lot) and bid at cut-off price
  5. Enter UPI ID linked with your bank account
  6. Approve mandate in your UPI app immediately after submitting
  7. Check status via broker/NSE platform (look for RC100 confirmation)

✅ Through Net Banking (ASBA):

  1. Login to your Net Banking portal (ICICI, HDFC, SBI, etc.)
  2. Click on “IPO” or “ASBA Services”
  3. Fill in required details for LOTUSDEV IPO
  4. Submit and verify — funds will be blocked automatically
  5. Track your application from bank or registrar dashboard

Expert Verdict: Should You Invest in LOTUSDEV IPO?

Sri Lotus Developers and Realty Ltd brings forward a strong growth proposition with a focus on leveraging India’s real estate potential. With no OFS, investors can be reassured that IPO proceeds will directly support growth initiatives such as land acquisition, project development, and infrastructure expansion.

👍 Why You Might Consider Subscribing:

  • 100% Fresh Issue – No promoter exit
  • Priced attractively for the segment
  • Favorable macro trend: Urban development push
  • Strong anchor investor backing
  • ₹14 discount for employees
  • Reasonable lot size for retail investors

👎 Risks to Consider:

  • Real estate sector is cyclical and interest rate sensitive
  • IPO market sentiment can fluctuate near listing
  • Depends on execution capability and upcoming project success

Final call? For moderate to long-term investors with appetite for real estate and infrastructure plays, LOTUSDEV IPO could offer value. However, those looking for quick listing gains should wait for Day 2–3 subscription numbers for better clarity.


Useful Links for Investors:


Disclaimer:

This article is for informational purposes only and does not constitute investment advice. Investors are encouraged to consult certified financial advisors before making any IPO investment decisions.

For More New IPO articles

Dow Jones Falters Near Resistance: Market Signals Mixed Ahead of August Trading


Introduction:

The Dow Jones Industrial Average (DJIA) entered the final week of July 2025 under pressure, failing to hold above its critical resistance near 45,200. Despite a robust rally earlier this month, the index closed lower on July 30, slipping below a key ascending trendline and signaling potential weakness ahead. Investors are now closely watching technical indicators and macroeconomic cues to assess whether this is a short-term correction or the beginning of a broader retracement. Here’s a breakdown of the latest chart behavior and what it means for market participants.


DJIA Faces Resistance at 45,200: Technical Breakdown Raises Caution

After a strong recovery phase from late June through mid-July, the Dow Jones Industrial Average faced a ceiling near the 45,200 mark—tested multiple times without success. This resistance level now acts as a psychological and technical barrier for further gains. On July 30, the index closed at 44,611.41, down by 21.58 points, and fell below its rising trendline support. This development is noteworthy, as trendline breakdowns often precede market corrections, especially after sharp rallies.

This technical setback suggests caution. Traders relying on momentum may begin to unwind positions, especially as the DJIA struggles to break above a triple-top pattern near 45,076–45,200. The current consolidation range between 44,000 and 45,000 now becomes critical, with a breakdown potentially exposing the index to deeper levels near 43,800 or even 43,300, which acted as the previous support base in early June.


The Bollinger Bands also hint at contraction in volatility. With price action hovering around the middle band (~44,525), this level serves as the first dynamic support. A decisive break below this zone could push the Dow toward the lower Bollinger Band at ~44,044, marking a possible 3-day drop zone if selling intensifies.

Additionally, the absence of significant buying volume during this pullback indicates a lack of conviction among bulls. Unless buying resumes with strong volume support, the index may face an extended period of consolidation or downside pressure.


Why August Could Be a Pivotal Month for Equities

As the market moves into August, several macroeconomic and technical factors could play a decisive role in shaping investor sentiment. Historically, August has been a volatile month for U.S. equity markets, often reacting to earnings surprises, geopolitical uncertainties, and seasonal weakness.

The Federal Reserve’s upcoming commentary on inflation and interest rate policy will also heavily influence market movement. With inflation easing but wage pressure remaining, investors anticipate a “data-dependent” tone from the Fed. This uncertainty may fuel market choppiness, especially in large-cap indices like the DJIA.

Moreover, corporate earnings season continues to unfold. While tech-heavy indices have seen stronger gains, many Dow components—such as Caterpillar, Johnson & Johnson, and Boeing—face margin pressure and international demand risks. If earnings disappoint, the Dow could underperform peers like the S&P 500 or Nasdaq in the near term.

Furthermore, market breadth is narrowing, with fewer stocks driving the index higher. Such conditions often precede reversals or corrections. Technical traders are particularly wary of bearish divergence forming in momentum indicators like the Relative Strength Index (RSI), which has failed to confirm new highs.


What Traders Should Watch: Key Levels and Scenarios

Key support and resistance levels to watch in the Dow Jones Industrial Average.

With the DJIA currently hovering near 44,600, the immediate level to monitor is the 44,525–44,500 zone, marked by the 20-day simple moving average (SMA) and Bollinger mid-band. If this level holds, we might see a short-term bounce back toward the 45,000 level. However, failure to maintain this support could trigger a fall toward the 44,044 level, aligned with the lower Bollinger Band.

Bearish Scenario:

  • Close below 44,525 with increased volume.
  • Next support levels: 44,044 → 43,800 → 43,300.
  • Possible sentiment shift to risk-off assets (bonds, gold).

Bullish Scenario:

  • Strong rebound from 44,525 with bullish candlestick reversal pattern.
  • Breakout above 45,200 with high volume confirms continuation.
  • Upside targets: 45,500 → 45,750 zone.

Investors are also advised to monitor Dow futures, global cues from Europe and Asia, and economic indicators like U.S. consumer spending, jobs data, and manufacturing output. Any surprise deviation from expectations can act as a trigger point in this fragile setup.


Conclusion: Is Dow’s Rally Losing Steam or Just Consolidating?

The Dow Jones Industrial Average is currently at a crossroads. While the index has gained over 2,000 points since its June lows, signs of exhaustion are emerging. The failure to break above 45,200, along with a breach of trendline support, is a technical red flag. Yet, the broader uptrend remains intact unless the Dow breaks below 43,800 on a closing basis.

Going forward, traders should stay nimble and maintain a risk-managed approach, especially ahead of macro events. For long-term investors, this may be an opportunity to accumulate fundamentally strong stocks on dips, but only after key support levels are respected.

Whether the Dow is simply pausing before another leg higher—or preparing for a deeper correction—will depend on how it performs in the coming sessions. Until then, the focus remains on volume, support levels, and broader market cues.


Disclaimer:
This article is for informational and educational purposes only. It does not constitute investment advice. Always consult a certified financial advisor before making any financial decisions.

Top 50 Crypto Coins

NSDL IPO 2025: All You Need to Know About India’s Largest Market Infrastructure Institution Going Public

21

Introduction:

India’s financial ecosystem is witnessing a monumental event with the upcoming Initial Public Offering (IPO) of the National Securities Depository Limited (NSDL). Scheduled from July 30 to August 1, 2025, the NSDL IPO is a significant milestone in the evolution of India’s capital markets. Backed by robust fundamentals, strong institutional support, and a trusted legacy, this IPO offers retail, institutional, and employee investors an opportunity to be a part of India’s leading securities depository.


What is NSDL?

National Securities Depository Limited (NSDL) is India’s first and largest securities depository. It facilitates the holding and transfer of securities in electronic format, playing a pivotal role in India’s dematerialization drive since the late 1990s. NSDL helps maintain investor accounts and ensures smooth functioning of transactions in the secondary market, offering safety, speed, and efficiency.


IPO Details at a Glance:

IPO DetailsInformation
SymbolNSDL
IPO DatesJuly 30 to August 1, 2025
Price Band₹760 – ₹800 per Equity Share
Discount for Employees₹76 per share
Face Value₹2 per share
Lot Size18 shares & multiples thereof
Minimum Order (Retail)18 shares
Issue Size50,145,001 equity shares (OFS)
Anchor Investor Portion1,50,17,999 equity shares
Issue Type100% Book Building
RegistrarMUFG Intime India Pvt Ltd
BRLMsICICI Securities, Axis Capital, HSBC, SBI Cap, IDBI Capital, HDFC, Motilal Oswal
UPI Cut-Off Date & TimeAugust 1, 2025, at 5:00 PM IST
IPO Market Timings10:00 AM to 5:00 PM IST

Objective of the Offer:

This IPO is an Offer for Sale (OFS) where existing shareholders are offloading 50,145,001 equity shares. There is no fresh issue, which implies the proceeds will go to the selling shareholders and not to the company. However, NSDL’s public listing aims to improve transparency, corporate governance, and offer investors a stake in a core market infrastructure institution.


SEBI Circular Compliance:

The IPO follows SEBI Circular SEBI/HO/CFD/DIL2/CIR/P/2019/76 dated June 28, 2019, which mandates the following:

  • Intermediaries must retain physical application forms with UPI as a payment mechanism for six months, then forward to the issuer/registrar.
  • Electronic forms’ printouts need not be retained.
  • Electronic records of all applications should be stored for a minimum of three years.

This ensures the transparency and accountability of the application process and investor protection in the UPI-based bidding process.


Key Investor Categories:

NSDL IPO is open to the following categories:

  • Retail Individual Investors (IND): Can apply via UPI (limit: ₹2,00,000)
  • Employees (EMP): Discounted shares (limit: ₹5,00,000)
  • Qualified Institutional Buyers (QIBs): Max bid of 3.5 crore shares
  • Non-Institutional Investors (NIIs): Max bid of 2.5 crore shares

Sub-categories like FI, IC, MF, FII, OTH, CO, IND, NOH, and EMP have been defined to ensure fair allocation.


Anchor Investors and Institutional Interest:

A portion of 1,50,17,999 equity shares is reserved for anchor investors, a move that ensures confidence and price stability during listing. With big institutions like mutual funds and foreign institutional investors showing interest, this IPO could see strong demand from long-term investors.


Price Band & Valuation:

  • Price Band: ₹760 – ₹800
  • Face Value: ₹2
  • Discount to Employees: ₹76 per share

Given NSDL’s strong financials, dominance in the market, and limited peers (CDSL being one), the valuation is expected to reflect premium listing potential.


UPI Mandate Deadline – A Crucial Update:

As per the new norms, the cut-off for UPI mandate acceptance is 5:00 PM on the final day (Aug 1, 2025). Only applications with status RC100 (i.e., mandate amount successfully blocked) will be considered valid.

Investors are urged to complete their applications and approve mandates well in advance to avoid systemic delays.


Comparison with Peers: NSDL vs. CDSL

While Central Depository Services (India) Limited (CDSL) is already listed and known to the public, NSDL has maintained a dominant position, especially in terms of:

  • Institutional clients
  • Market infrastructure depth
  • Operational scale and technological backbone

Post-listing, NSDL will become a key competitor to CDSL in the public markets and may attract institutional investors looking for long-term infrastructure exposure.


What Makes NSDL IPO Attractive?

  1. Market Leadership: NSDL handles a significant portion of India’s demat accounts and securities transactions.
  2. Revenue Visibility: It earns steady income from account maintenance, settlement, and transaction charges.
  3. Growth Opportunity: With increasing retail participation in equities and digital adoption, NSDL is set for long-term growth.
  4. Robust Governance: Managed by top-tier institutions and regulators, NSDL maintains strong operational and legal integrity.
  5. Technological Backbone: Known for its reliability and secure infrastructure for capital markets.

Risks & Challenges:

  • No Fresh Issue: Funds raised won’t directly benefit NSDL.
  • Regulatory Oversight: As a core infrastructure institution, any change in SEBI norms could impact operations.
  • Dependence on Market Volume: Revenue is linked to market activity, which may vary during downturns.
  • Peer Competition: With CDSL’s strong retail push, NSDL’s growth in that segment could be challenged.

Grey Market Premium (GMP) Buzz:

As per market rumors, NSDL IPO is expected to fetch a premium in the unofficial grey market, with many investors anticipating a strong listing above ₹900, indicating bullish sentiment among IPO watchers.


Conclusion:

The NSDL IPO 2025 is not just another public issue—it’s an opportunity to invest in the very infrastructure that powers India’s booming equity markets. With transparent governance, strong fundamentals, and limited competition, NSDL offers a compelling long-term investment option.

Investors should consider their financial goals and consult advisors before applying. But with high expectations from institutional buyers and a strong business model, NSDL is likely to make a strong debut on the stock exchanges.


Disclaimer:

This article is for informational purposes only and does not constitute financial advice or a recommendation to invest. Investors are advised to consult their financial advisors and review the NSDL IPO red herring prospectus (RHP) before making any investment decisions. Market investments are subject to risks including capital loss.

Top Crypto Coins

Bitcoin Price Analysis: BTC Faces Critical Support at $116K Amid Sideways Consolidation

22

Introduction

Bitcoin (BTC) has entered a phase of sideways consolidation, hovering between the $116,000 and $120,000 range, with technical indicators hinting at a potential breakout—or breakdown. After a strong rally earlier in July, the cryptocurrency is struggling to maintain bullish momentum. As traders watch closely, BTC has now retested a critical support level around $116,000, raising important questions about where the market might head next.


Sideways Action Dominates as Bulls Lose Steam

Following a steep rally in early July that pushed Bitcoin above multiple resistance zones, the cryptocurrency now finds itself in a tight consolidation range. Since reaching a local high near $122,000, BTC has formed several lower highs and higher lows, indicating indecision in the market.

“Bitcoin price movement on daily chart showing tightening consolidation zone.”

Bitcoin is currently trading near $117,700, slightly below the 20-day Simple Moving Average (SMA), and has just dipped under the middle Bollinger Band. This move is noteworthy, as it often signals weakening momentum and increased chances of a correction unless immediate support holds.

The Bollinger Bands have narrowed, reflecting reduced volatility. Meanwhile, trading volume has diminished, which further reinforces the sideways structure. Notably, each recent red candle has come with higher sell volume, suggesting bears are gradually gaining strength.

Support around $116,000—previously tested multiple times—is acting as a key pivot. If BTC closes decisively below this zone, it could open the doors to a short-term bearish correction, potentially toward the $112,000–$110,000 levels. On the flip side, bulls need to reclaim $120,000 and close above $122,000 for the next leg up.


Volume Profile and Market Sentiment Suggest a Tipping Point

Analyzing the volume bars at the bottom of the chart, we can clearly see two spikes: one during the breakout phase around July 9–10, and another during the sudden sell-off on July 25. The second spike is more concerning for bulls, as it indicates profit-taking or panic selling at higher levels.

Investor sentiment appears to be shifting from greed to fear. According to the Fear and Greed Index, Bitcoin sentiment has dropped from “Greed” last week to “Neutral” today. This swing reflects growing trader anxiety as BTC struggles to hold above $117,000.

Whale activity, which can often precede major price swings, has also tapered off. According to on-chain data from Glassnode, the number of large BTC transactions (over $1 million) has decreased by over 18% in the last seven days. Additionally, exchange inflows have slightly increased, hinting at possible sell-side pressure building up.

The RSI (Relative Strength Index) is hovering just below the neutral 50 level, signaling neither overbought nor oversold conditions. This further confirms the consolidation narrative but adds weight to the fact that BTC could tip in either direction depending on external catalysts—like macroeconomic news or regulatory developments.


Macro Factors and Regulatory Uncertainty Cloud Bitcoin’s Next Move

Beyond technicals, broader macroeconomic developments and ongoing regulatory news continue to impact Bitcoin’s short-term and medium-term outlook.

Just last week, the U.S. Federal Reserve kept interest rates unchanged but reiterated its data-dependent stance. With inflation cooling but still above the 2% target, uncertainty looms about future rate hikes. For risk assets like Bitcoin, any hawkish pivot from the Fed could cause downward pressure.

Meanwhile, the SEC’s delayed decisions on multiple Bitcoin ETF applications, including those from BlackRock and Fidelity, are keeping institutional investors on the sidelines. Any update on ETF approvals—or further delays—could be a major price mover.

The growing legal pressure on crypto exchanges also adds a bearish undertone. Ongoing lawsuits against major players like Binance and Coinbase have stoked regulatory fear among retail and institutional participants alike. The broader question now becomes: how will the market digest this uncertainty?

Bitcoin’s status as a “safe-haven” during economic turmoil is also being tested. With gold prices rising and the U.S. dollar index strengthening, capital may temporarily flow away from crypto into traditional hedges.


Where Does Bitcoin Go From Here? Key Levels and Forecasts

Support Levels to Watch:

  • $116,000: Immediate support; breakdown could lead to increased bearish pressure.
  • $112,000–$110,000: Secondary support zone, previous accumulation area.
  • $106,000: Strong base from early July breakout.

Resistance Levels:

  • $118,200 (20-SMA): Currently acting as dynamic resistance.
  • $120,000–$120,100: Psychological and technical resistance.
  • $122,000: Local high and breakout point for bullish continuation.

If Bitcoin breaks below $116K with volume confirmation, a decline toward $112K could play out rapidly. However, a bounce from current levels with increased volume could spark another rally to test $122K—and possibly $124K if momentum returns.

Crypto analysts remain divided. While some expect another leg down before a potential pre-halving rally, others believe BTC is simply coiling for a bullish breakout in August. The key, however, lies in volume and external sentiment drivers.

Long-term investors are advised to stay cautious, use dollar-cost averaging (DCA) strategies, and monitor both technical indicators and global financial trends.


Disclaimer

The information provided in this article is for educational and informational purposes only and should not be construed as financial advice. Always conduct your own research or consult with a qualified financial advisor before making investment decisions.

Top 50 Crypto Coins

Global Markets Update: Dow Slides While Europe Surges as Investors Balance Caution and Optimism

16

Introduction:

As July 29, 2025, closed across major financial markets, a contrasting trend painted the global economic canvas. While U.S. indices like the Dow Jones, S&P 500, and Nasdaq ended in the red, European markets surged ahead, powered by investor optimism and strong quarterly earnings. This divergent performance reveals underlying investor sentiments shaped by inflation cues, central bank outlooks, and regional economic resilience. Here’s a deep dive into the latest movements across U.S. and European markets.


Mixed Global Sentiments as US Indices Decline and Europe Advances

On July 29, 2025, the U.S. markets exhibited a cautious tone. The Dow Jones Industrial Average slipped by 180.22 points or 0.40%, settling at 44,657.34, reflecting profit booking and cautious sentiment ahead of economic data. The S&P 500 followed suit, down by 8.81 points (0.14%) at 6,380.71, while the Nasdaq Composite dropped 44.30 points, marking a 0.21% decline to close at 21,134.28.

These declines come despite the indices holding bullish year-to-date (YTD) ratings: Dow at +4.97%, S&P 500 at +8.49%, and Nasdaq at a strong +9.47%. Analysts attribute today’s pullback to investor hesitation amid upcoming inflation reports and earnings announcements. Technical ratings across all three U.S. indices remain “Very Bullish”, suggesting long-term optimism remains intact.


Deeper Look: US Markets Reflect Consolidation Before Big Data Week

The broader weakness in the U.S. equity markets comes as no surprise. Investors are awaiting the upcoming U.S. Federal Reserve policy update and GDP growth figures due later this week. Tech stocks, which had been driving Nasdaq higher, saw mild corrections as traders locked in profits.

  • The Dow Jones had a trading range between 44,601.82 (Low) and 44,883.66 (High).
  • The S&P 500 hovered between 6,367.43 (Low) and 6,409.26 (High).
  • Nasdaq Composite posted a high of 21,303.96 and a low of 21,081.69, showing some intraday volatility.

This pattern suggests healthy consolidation after a recent bull run. According to market strategist Laura Mitchell of EquityPath, “We’re seeing investors pause ahead of inflation figures. The markets have rallied quite strongly in Q2, and some cooling off is not just expected—it’s necessary for sustainable growth.”

Despite today’s red closing, U.S. equity markets remain structurally strong, with high investor confidence in AI, green energy, and infrastructure stocks.


European Markets Rally Led by Germany’s DAX and Strong Earnings

While Wall Street slowed down, European stock markets closed the session on a high note, extending their bullish run. The FTSE 100 rose 56.51 points (+0.62%) to 9,137.95, the CAC 40 jumped 51.22 points (+0.65%) to 7,852.10, and Germany’s DAX outperformed all, surging 241.04 points (+1.00%) to end at 24,211.40.

The rally was driven by a mix of robust earnings from industrial giants and rising investor optimism over ECB’s dovish stance. All three indices boast a “Very Bullish” technical rating, with year-to-date gains of FTSE: 10.63%, CAC: 6.20%, and DAX: 20.91%—highlighting strong economic momentum in Europe.


Caption suggestion: European markets rally strongly on July 29, 2025, led by Germany’s DAX index.


What’s Fueling Europe’s Bullish Run? A Closer Look

Europe’s outperformance is backed by multiple catalysts:

  1. German Economic Confidence: Germany’s Q2 GDP beat expectations, and inflation numbers showed further cooling, prompting investors to favor DAX-heavy industrials and automakers like BMW and Siemens.
  2. FTSE and Commodity Boost: The U.K.’s FTSE gained ground as oil prices stabilized, boosting commodity-linked stocks like BP and Shell. Investors also gained confidence in BOE’s neutral stance, signaling no aggressive hikes ahead.
  3. French Tech and Finance Support CAC: The CAC index benefited from gains in finance (BNP Paribas) and technology (Dassault Systemes), reflecting the broader strength across the eurozone.

“European earnings are outperforming expectations,” said Oliver Brandt, senior analyst at Zurich-based FinCap. “With inflation softening and rate pressures easing, risk appetite is returning to the continent’s equity markets.”

This divergence between U.S. and European markets suggests region-specific catalysts are now driving trades rather than a uniform global macroeconomic narrative.


Future Outlook: Will the Bulls Continue to Run?

Despite short-term dips in the U.S., analysts remain optimistic on global equity markets going into Q3 and Q4 of 2025.

Key focus areas include:

  • U.S. inflation data release: Will determine the Fed’s next move.
  • ECB’s next policy meeting: Markets expect dovish signals, which could further lift European indices.
  • Corporate earnings: Tech giants like Apple, Meta, and Volkswagen are expected to announce Q2 results soon.

Traders are advised to stay cautious but invested. Diversification remains key, especially given the variance in performance across regions.


Insert Relevant Image Here

Caption suggestion: Market trends diverge across Atlantic as Europe rallies and U.S. takes a pause.


Disclaimer:

This article is for informational purposes only and does not constitute financial advice. Investors are advised to do their own research or consult a professional before making any investment decisions. Market data as of July 29, 2025, IST.

Top 50 Crypto Coins

Wall Street Closes Lower: Dow Falls 180 Points, S&P 500 and Nasdaq Dip – But Bullish Momentum Remains Intact


Introduction:

On July 29, 2025, the US stock markets saw modest declines as the Dow Jones Industrial Average slipped by 180 points, while the S&P 500 and Nasdaq also ended slightly lower. Despite this short-term pullback, year-to-date (YTD) gains across all three indices remain firmly positive, signaling underlying investor confidence and continued bullish momentum. The broader market tone was cautious, driven by upcoming earnings reports, economic data releases, and interest rate speculation.


Wall Street Ends Lower, But Technical Ratings Remain ‘Very Bullish’

Even though Tuesday’s trading session ended in the red, the market’s long-term technical outlook remains optimistic. The Dow Jones closed at 44,657.34, dropping 180.22 points (-0.40%), while the S&P 500 slipped 8.81 points (-0.14%) to end at 6,380.71. The tech-heavy Nasdaq declined by 44.30 points (-0.21%), finishing the day at 21,134.28.


“Wall Street indices slipped slightly on July 29, 2025, but investor sentiment remains optimistic.”


The 52-week highs for each of the major indices—Dow at 45,073.63, S&P at 6,409.82, and Nasdaq at 21,303.96—suggest that the current dips are minor pullbacks from record-breaking levels. All three indices have seen strong YTD gains:

  • Nasdaq: +9.47%
  • S&P 500: +8.49%
  • Dow Jones: +4.97%

The technical rating for each index still shows “Very Bullish“, indicating that market fundamentals remain sound despite short-term pressures.


What Drove Today’s Pullback in the US Markets?

The slight correction in Tuesday’s session was largely attributed to a combination of profit-taking, cautious trading ahead of key earnings, and concerns around upcoming macroeconomic data, particularly July’s non-farm payroll numbers and core PCE inflation, both due later in the week.

Investors were also weighing statements from Federal Reserve officials, who hinted at a “data-dependent” approach to future rate decisions. This stance has added to speculation about whether the Fed will hold or cut interest rates during its September meeting.

“Markets are now recalibrating expectations. With inflation showing signs of softening and GDP growth stable, the Fed might consider easing its stance,” said Emily Richards, a senior market strategist at GlobalEquity Advisors.

Additionally, big tech earnings expected from Apple, Amazon, and Meta this week are keeping traders on edge, with volatility expected to rise post-announcements. Tech stocks, in particular, have had a significant run-up in the last quarter, making them vulnerable to corrections if earnings disappoint.


Sector Overview and Stock Performance Highlights

While the indices were broadly lower, sectoral performance varied. Defensive sectors like healthcare and utilities saw modest gains, whereas technology, financials, and consumer discretionary stocks faced moderate selling pressure.

Some stock-specific highlights:

  • Apple (AAPL) slipped slightly ahead of earnings, down 0.4%.
  • Tesla (TSLA) dipped 1.2% on weaker-than-expected Q2 vehicle delivery forecasts.
  • Nvidia (NVDA) managed to close flat after recovering from early session losses.

On the flipside, energy stocks outperformed, supported by a small rise in crude oil prices driven by supply disruptions in the Gulf of Mexico.

“We’re seeing rotation from growth to value and a bit of a safety play today,” noted Marcus Holden of Sigma Capital.

The bond market also saw limited movement, with the yield on the 10-year Treasury note hovering around 4.19%, reflecting stability in inflation expectations.


Outlook: What’s Next for the US Stock Markets?

Despite today’s dip, analysts remain largely optimistic about the market’s medium-term trajectory. Here’s what to watch for:

🔹 Key Events Next Week:

  • FOMC rate decision preview commentary
  • US Non-Farm Payroll (Friday, Aug 2)
  • Core PCE Inflation (Thursday, Aug 1)
  • Tech earnings: Amazon, Meta, Apple
  • ISM Manufacturing Index & Services Data

🔹 Bullish Drivers:

  • Robust corporate earnings
  • Improving labor market trends
  • Slowing inflation and resilient consumer demand
  • Global central banks moving toward accommodative stances

🔹 Risks to Watch:

  • Hawkish Fed surprises
  • Geopolitical tensions (e.g., in Taiwan Strait or Middle East)
  • Weak corporate guidance despite good earnings

“The market has priced in a soft landing scenario. The challenge now is sustaining growth amid rising valuations,” explained Laura Kim, equity strategist at Vanguard Partners.


Conclusion: Bullish Bias Intact Despite Minor Pullbacks

Tuesday’s dip in the Dow, S&P 500, and Nasdaq was more of a healthy breather than a trend reversal. With all three indices still up significantly YTD and trading near their 52-week highs, market momentum continues to be fueled by strong earnings, solid macroeconomic fundamentals, and a resilient consumer base.

As we move into August, investor focus will remain sharp on inflation trends and tech earnings. While short-term volatility may continue, the broader picture still favors a “buy-on-dip” strategy—especially in fundamentally strong sectors like tech, energy, and healthcare.


✅ Disclaimer:

This article is intended for informational purposes only and should not be taken as financial advice. Investing in the stock market involves risk. Please consult with a licensed financial advisor before making any investment decisions.

Top 50 Crypto Coins

Nike Leads the Dow While Travelers Stumbles: Top Gainers and Losers on Wall Street Today

7

Introduction

Wall Street saw mixed sentiment on July 29, 2025, with notable shifts in the Dow Jones Industrial Average (DJIA). While some giants like Nike and Nvidia posted significant gains, traditional stalwarts like Travelers Companies and Coca-Cola faced selling pressure. This article provides a detailed look into the top five gainers and losers of the day, examining the market drivers behind the moves, investor reactions, and what this might mean for the week ahead. Here’s how the action unfolded on the U.S. blue-chip index.


Nike Sprinting Ahead: The Top Gainers Steal the Spotlight

Nike Inc. led the gainers’ list on the Dow Jones with a stellar jump of 3.93%, closing at $79.27. The sportswear giant was followed closely by Boeing, Nvidia, Home Depot, and Amazon — all showing resilience amidst broader market caution.

“Nike Inc. stock soars after Q2 earnings beat expectations.”

The surge in Nike stock came after the company released better-than-expected quarterly earnings, driven by strong digital sales and cost-cutting measures. Analysts noted that Nike’s direct-to-consumer strategy continues to yield results even as global economic uncertainty persists.

Similarly, Boeing rose 0.90% to close at $235.15, signaling increasing optimism in the aviation sector amid a surge in aircraft orders from Asia and the Middle East. Nvidia’s impressive 1.11% gain, closing at $175.43, was attributed to continuing momentum in the AI hardware sector. Wall Street remains bullish on the chipmaker, with its 3-month return now at a staggering 61.30%.

Home Depot and Amazon also climbed modestly, reflecting steady consumer demand in retail and e-commerce, even as the U.S. grapples with inflationary pressures and high interest rates. Home Depot ended the session at $378.10 (+0.74%), while Amazon closed at $232.70 (+0.54%).


Tech, Retail, and Aviation Fuel the Rally for Select Blue-Chips

Today’s gains in sectors like tech, aviation, and retail weren’t just about investor enthusiasm — they were built on strong fundamentals. Nike’s quarterly earnings showed a 9% year-on-year revenue increase, largely from North American markets, thanks to its innovative product lines and growing e-commerce base. CEO John Donahoe credited their “agile inventory strategy” and stronger margins for the surprise upside.

Meanwhile, Nvidia continues to ride the AI revolution wave. With global companies ramping up investments in generative AI infrastructure, Nvidia remains a preferred pick among institutional investors. Its data center business reported record growth, boosting investor confidence.

Boeing, on the other hand, gained traction as travel demand surged this summer, with international carriers placing bulk aircraft orders. This comes after a prolonged dry spell due to COVID-19, and signals renewed investor optimism in the aerospace sector. “We believe Boeing is poised for a strong rebound in 2025 and beyond,” said JP Morgan analyst Emily Carter.

Amazon and Home Depot reflected resilience in consumer spending. Despite inflationary concerns, consumer staples and home improvement demand are holding up, thanks in part to stabilizing interest rates and a robust labor market.


Travelers, Cisco, and Coca-Cola Among the Dow’s Biggest Drags

While some stocks soared, others saw notable declines. Leading the laggards was Travelers Companies, which fell by 2.48% to $254.57. It was followed by Cisco Systems, Verizon, Coca-Cola, and Johnson & Johnson, all of which posted modest but impactful losses.

Travelers’ stock drop was attributed to weak Q2 earnings and a rising claims ratio, especially from recent natural disasters in the Midwest. Additionally, analysts flagged growing underwriting costs and slower premium growth in personal lines as major red flags.

Cisco Systems also dipped 1.51% to close at $67.65. Despite strong enterprise demand, concerns over slower product rollouts and macro headwinds in Europe dragged sentiment. Investor confidence appears shaken following a downward revision in full-year guidance.

Verizon and Coca-Cola—two traditionally stable dividend stocks—fell 1.60% and 1.42%, respectively. This was seen as part of a broader investor move out of defensive sectors and into growth-oriented names like tech. Coca-Cola is also facing pressures due to declining soda consumption trends among younger consumers and currency headwinds in emerging markets.

Johnson & Johnson dipped 1.34% despite maintaining a “Very Bullish” technical rating. This drop appears to be more of a short-term correction, as the company still has positive momentum based on long-term fundamentals and a strong pipeline in pharmaceuticals.


What This Means for Investors: Volatility and Sector Rotation Ahead

This market activity suggests an ongoing sector rotation, where investors are recalibrating their portfolios away from defensive plays and into high-growth opportunities. Tech, retail, and aviation sectors are gaining traction, while insurers and traditional consumer giants are showing signs of weakness.

Market analysts believe that July’s earnings season has been the key driver behind this divergence. “Earnings beats are being richly rewarded, while any sign of weakness is punished quickly,” said Lila Morgan, market strategist at Morgan Stanley. She emphasized that investors should stay nimble, especially as the U.S. heads into the final quarter of the fiscal year.

Interestingly, the moves in Dow components also align with broader economic signals — stable unemployment, easing inflation, and improved business confidence. However, potential interest rate changes from the Federal Reserve and geopolitical tensions could still trigger short-term volatility.

Long-term investors may see this as a buying opportunity in high-quality names like Nvidia and Amazon, while others might consider trimming exposure to underperforming defensive stocks until stability returns.


Outlook for August 2025: What’s Next for the Dow?

“Investors eye earnings and Fed commentary as August trading begins.”

As we step into August, the Dow Jones is likely to remain sensitive to corporate earnings, inflation data, and central bank commentary. Analysts expect continued outperformance in tech and industrials, especially with infrastructure spending and AI adoption gaining momentum.

However, caution remains the watchword. Sectors like insurance, legacy telecom, and consumer beverages may face margin pressures and demand slowdowns. Traders will be watching for key economic indicators such as non-farm payrolls, CPI data, and retail sales figures in early August.

Global cues—especially from China’s stimulus moves and Europe’s GDP performance—will also influence U.S. indices. For now, the market seems to favor innovation and agility over tradition and scale.

If current patterns persist, stocks like Nike, Nvidia, and Amazon could lead the next leg of the rally, while laggards like Travelers and Coca-Cola may need a strong catalyst to recover ground.


Disclaimer

This article is intended for informational purposes only and should not be considered financial or investment advice. Readers are advised to consult with their financial advisor before making investment decisions.

Dow Jones Nears Breakout: Rising Wedge Signals Key Reversal or Continuation?

Indian Markets Slide: Nifty 50 Drops 156 Points, BSE Smallcap Hit Hardest With 1.31% Loss

10

Introduction:
Indian equity markets saw a sharp decline in today’s session, with all major indices closing in red. The benchmark Nifty 50 shed 156.10 points (-0.63%), while the BSE Sensex dropped over 572 points (-0.70%). The broader market bore heavier losses, with the BSE Smallcap index plunging 704 points (-1.31%). Global uncertainties, earnings pressure, and institutional selling weighed heavily on investor sentiment.


Weak Start to the Week: Key Indian Indices Under Pressure

Monday’s trading session turned negative for Dalal Street, extending last week’s cautious tone. The Nifty 50 settled at 24,680.90, losing 156 points, while the Sensex ended the day at 80,891.02, down 572 points. Bank Nifty and sectoral indices like Nifty IT and BSE Smallcap followed suit, mirroring the bearish mood across the board.

This correction was largely attributed to:

  • Profit booking at higher levels
  • Weak global cues, especially from the US and Chinese markets
  • Volatility due to ongoing earnings season
  • Cautious approach ahead of the RBI policy meeting

Among sectors, IT, banking, and smallcaps led the decline, while defensive sectors like FMCG and pharma witnessed relative strength.

“Indian Market Indices End Lower – Source: NSE/BSE Data (28 July 2025)”


Sector-Wise Breakdown: Smallcaps Bleed the Most

The worst-performing segment of the day was the BSE Smallcap Index, which dropped a massive 704.09 points (-1.31%), closing at 53,202.37. Broader market weakness signals that retail investors are exiting positions amid macro uncertainty and valuation concerns.

The Nifty IT index also came under heavy selling pressure, ending at 35,370.05, down 253.70 points (-0.71%). Weak Q1 earnings, muted guidance from large-cap IT firms, and a strong dollar weighed down the sentiment in the tech sector.

Bank Nifty declined by 444.00 points (-0.79%), closing at 56,084.90. Analysts attribute this to:

  • Margin pressure on mid-sized banks
  • Slowdown in credit growth
  • FII outflows from the banking sector

No sector emerged unscathed, but relatively less impact was seen in large-cap FMCG stocks, which are seen as safer bets during volatile phases.


Institutional Activity and Global Impact

Foreign Institutional Investors (FIIs) were net sellers in today’s session, pulling capital from Indian equities due to:

  • Rising US bond yields
  • Strengthening dollar
  • Weak Chinese economic indicators

Domestic Institutional Investors (DIIs) did attempt to support the markets, but the selling pressure from FIIs outweighed the inflows.

Global cues also remained weak. US futures were in red, and Asian peers like Nikkei and Hang Seng showed significant declines, adding to domestic nervousness. This global risk-off mood dragged Indian markets down, especially growth-driven indices like Nifty IT and BSE Smallcap.


Technical View: Nifty and Sensex Near Critical Levels

Nifty 50 is now trading near key support at 24,600, and any break below could trigger more downside. On the upside, resistance remains around 24,850–24,900. Analysts suggest waiting for a clear breakout or reversal confirmation before making aggressive trades.

Sensex, after breaking its short-term support, could test 80,500–80,300 zones in the near term. If that level fails to hold, a move toward 79,800 is possible.

Bank Nifty’s pattern also reflects a short-term bearish trend. A fall below 55,800 might open up further weakness.


Outlook: What Investors Should Watch Next

Investors are advised to keep an eye on the following catalysts:

  • RBI Policy Review: A rate pause is expected, but forward guidance will be crucial
  • US Fed Decision: Any hawkish surprise can trigger fresh volatility
  • Earnings Reports: Heavyweights from auto, banking, and FMCG are yet to report
  • FIIs Activity: Continuous selling may further pressure the market

Volatility is likely to remain high in the near term. Traders should focus on quality stocks and hedged positions, while long-term investors may find opportunities in selective dips.


Final Thoughts: Correction or Start of a Deeper Fall?

While today’s market correction was broad-based, analysts remain divided on whether it signals a deeper fall or a healthy pullback.

  • Bullish View: Some experts believe this is a temporary correction due to profit booking and macro triggers. Strong domestic fundamentals and GST collection data may support a rebound.
  • Bearish View: Others caution that persistent FII selling and weak global cues could drag markets lower in the short term.

Momentum indicators suggest caution. Traders should consider reducing leveraged positions and waiting for trend confirmation.


Disclaimer:
This article is for informational purposes only and does not constitute investment advice. Investors are advised to consult with certified financial advisors and conduct their own research before making any financial decisions.

Dow Jones Nears Breakout: Rising Wedge Signals Key Reversal or Continuation?

Dow Jones Nears Breakout: Rising Wedge Signals Key Reversal or Continuation?

Introduction:
The Dow Jones Industrial Average (DJIA) is currently hovering near a critical resistance zone around the 45,000 level. Recent price action shows consolidation within a rising wedge pattern—often a warning of potential trend reversals. With Bollinger Bands tightening and volumes stabilizing, traders are now eyeing either a bullish breakout or a correction from this technically significant zone. This analysis explores the current trend, chart signals, and future outlook for the Dow Jones.


DJIA Analysis: Approaching Major Resistance Around 45,000

The Dow Jones Industrial Average closed at 44,859.54, down 42.38 points (-0.09%) as per the latest daily chart. This small dip, though seemingly insignificant, comes at a pivotal technical juncture.

The index has been steadily climbing, forming higher lows, which define the lower boundary of a rising wedge. However, the price action is now brushing up against a flat upper resistance zone near 45,076.99. This creates a compression zone—a hallmark of wedge formations—that often precedes significant breakouts or breakdowns.

Bollinger Bands are narrowing, signaling reduced volatility. This squeeze could mean the market is preparing for an explosive move in either direction. The 20-day SMA is currently around 44,494.29, serving as immediate dynamic support.

“Dow Jones Rising Wedge Pattern Near 45,000 Resistance – Source: TradingView”


What the Chart Signals Say: Rising Wedge Pattern Nearing Apex

A rising wedge pattern, typically viewed as bearish in an uptrend, has been clearly forming over the past month. The lower trendline has been respected multiple times, creating strong bullish pressure. However, the horizontal resistance around 45,076.99 has capped upward moves consistently.

Here’s what’s key from the chart:

  • Wedge Formation: A rising wedge signals exhaustion of bullish momentum, with buyers struggling to break overhead resistance.
  • Bollinger Band Behavior: The Bollinger Bands are tightening, and price is hugging the upper band—suggesting either a continuation or reversal is imminent.
  • Volume Note: Volume appears to be decreasing slightly—another classic sign of consolidation before a breakout or breakdown.
  • Support Levels: Should the wedge break downward, initial support lies around 44,000–44,200, followed by stronger zones near 43,500.
  • Breakout Potential: If bulls push past 45,100 with strong volume, a breakout could target 46,000+ in the coming sessions.

These patterns often resolve quickly, and traders may look for confirmation via candle patterns or a spike in volume above the wedge top.


Broader Context: Earnings Season, Fed Policy, and Inflation Concerns

While the technical chart tells one part of the story, macroeconomic fundamentals are also playing a critical role in DJIA’s current setup.

  • Earnings Season: As Q2 earnings continue to roll in, major Dow components such as Apple, Microsoft, and Visa are set to report. Positive surprises could fuel a bullish breakout, while disappointment could trigger a pullback.
  • Federal Reserve Policy: The market is awaiting clarity on the Fed’s stance regarding interest rate cuts. Current expectations are leaning toward a rate pause, but sticky inflation could delay that.
  • Inflation Pressure: The U.S. CPI and PCE data will heavily influence Dow movements. If inflation remains high, equities could face renewed pressure.
  • Geopolitical Factors: Global tensions and economic slowdown in China are keeping risk sentiment in check, which might cap DJIA’s upside.

These fundamental headwinds could trigger either validation or invalidation of the technical pattern we are seeing.


Final Outlook: What to Watch Going Into August

As we approach the end of July and step into a historically volatile August, the DJIA sits at a crucial decision point. Traders should monitor:

  • Breakout Confirmation: A daily close above 45,100 with strong volume.
  • Breakdown Alert: A breakdown below 44,500, especially with increasing sell volume, may lead to a drop toward 43,500 or lower.
  • MACRO Signals: Watch for macro news, especially the next FOMC minutes, unemployment claims, and inflation numbers.
  • Sector Rotation: Tech and financial sectors are driving the Dow; rotation into defensive names could signal near-term weakness.

A confirmed breakout could see the Dow testing 46,000–46,200, while a failure may pull it back to the 43,000 zone.


Disclaimer:
This analysis is intended for informational and educational purposes only and should not be considered financial advice. Always conduct your own research or consult with a certified financial advisor before making investment decisions.

Top 50 Crypto Coins