Home Blog Page 2

Bitcoin Price at a Crossroads: Inside the BTCUSD Chart, Market Fear, and What the Next Move Could Mean

0

If you have been watching Bitcoin lately, you probably feel a mix of confusion, anxiety, and cautious hope. One day the market looks ready to bounce, and the next day fear quietly creeps back in. The BTCUSD chart tells a powerful story — not just of numbers, but of emotions, expectations, and patience being tested. This article breaks down the current Bitcoin price structure in simple, human-friendly language, explaining what the chart reveals, why traders are cautious, and what the coming weeks could mean for investors and long-term believers.

Understanding the Current Bitcoin Price Structure

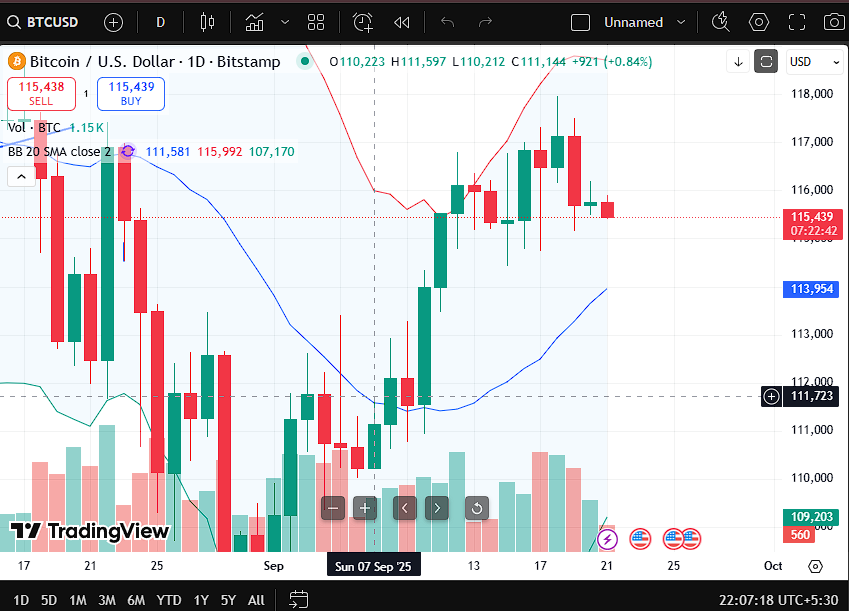
Bitcoin’s daily chart reveals a market that has gone through intense emotional phases — optimism, panic, exhaustion, and now hesitation. After reaching higher price levels earlier, Bitcoin faced strong rejection and entered a sharp correction. This decline was not slow or gentle; it was aggressive, reflecting fear-driven selling and profit booking by large players. Such moves usually shake confidence, especially among retail investors who buy near highs.

At present, Bitcoin is trading well below its previous resistance zone, indicating that sellers still control the broader trend. However, the selling pressure has slowed. The price has started moving sideways, forming a structure where buyers are quietly trying to regain strength. This phase is critical because markets often decide their next major direction here — either a recovery rally or another breakdown.

From a psychological standpoint, this is where emotions are mixed. Some traders see opportunity, others fear further losses. The chart shows price compression, which often precedes a strong move. The direction of that move will define sentiment for months ahead.

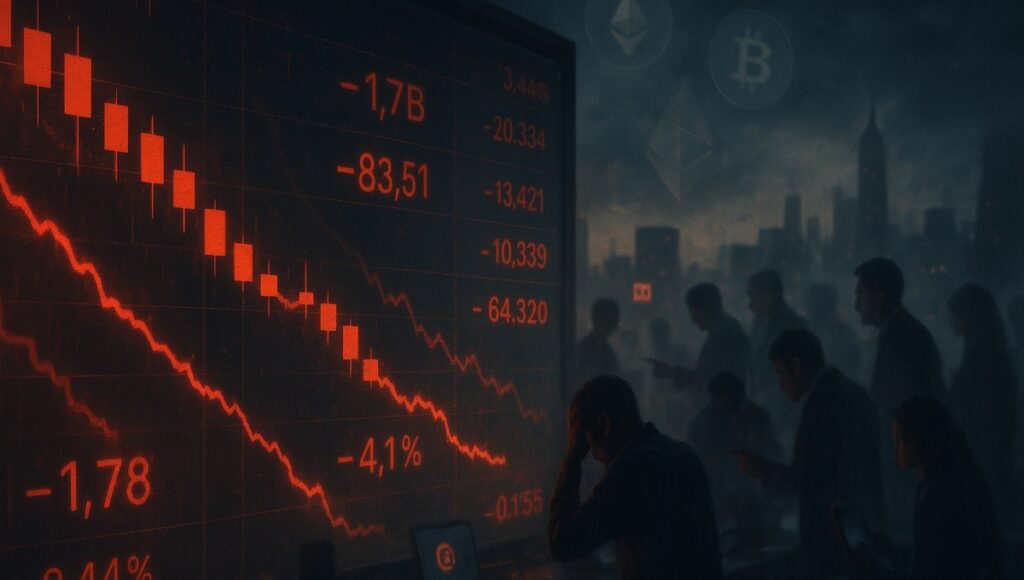
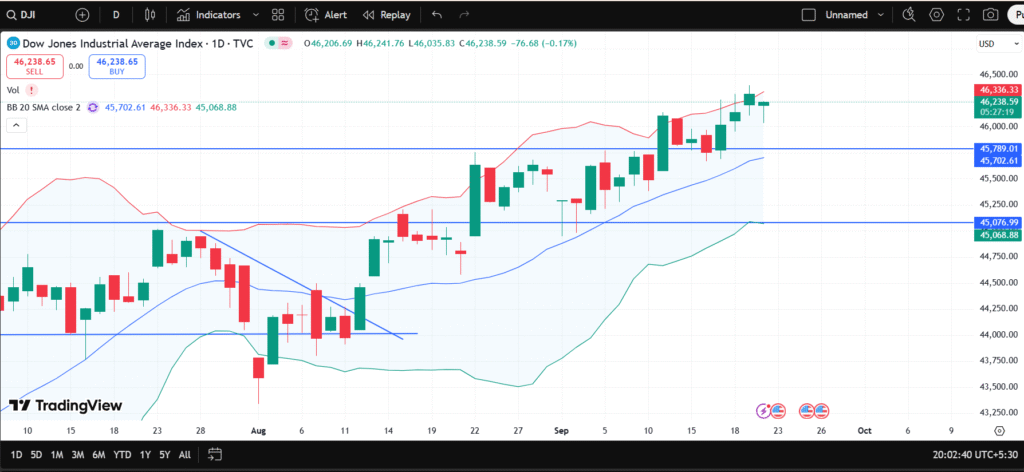
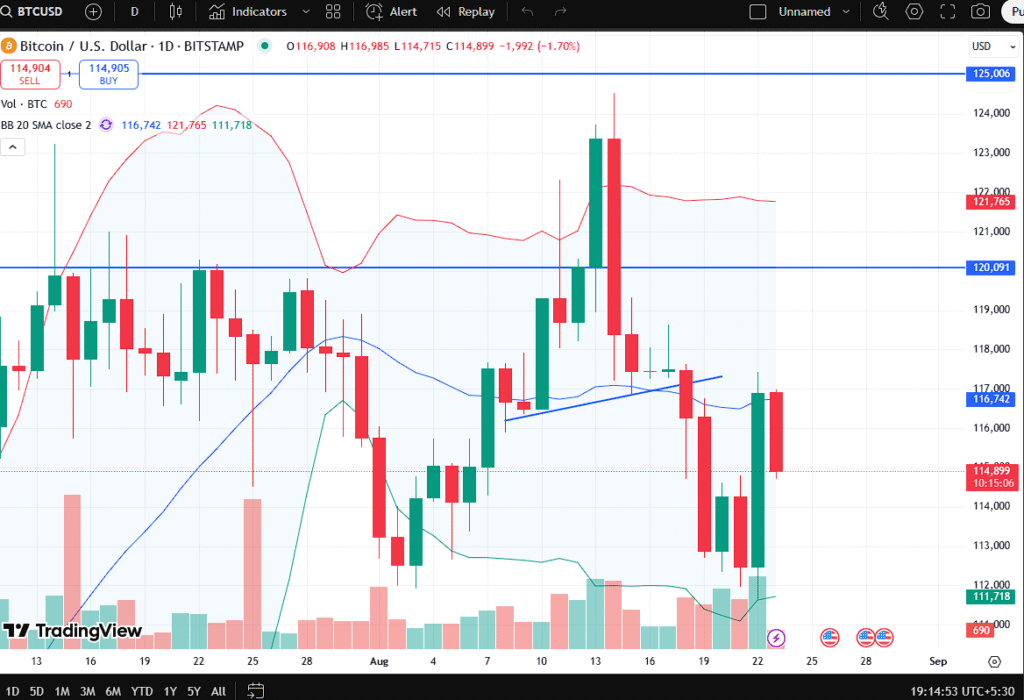
Bitcoin (BTCUSD) daily chart showing correction phase and consolidation pattern.

Deep Dive into Support, Resistance, and Market Psychology

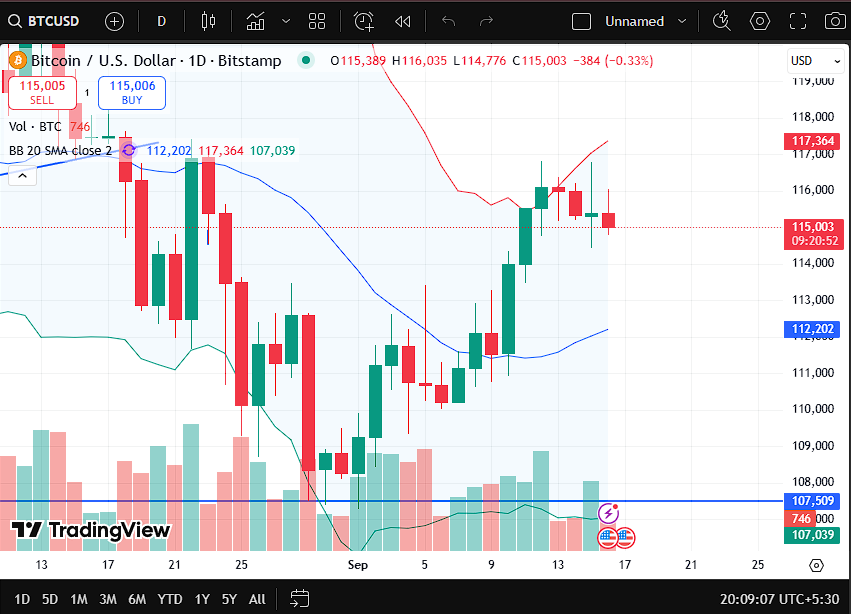
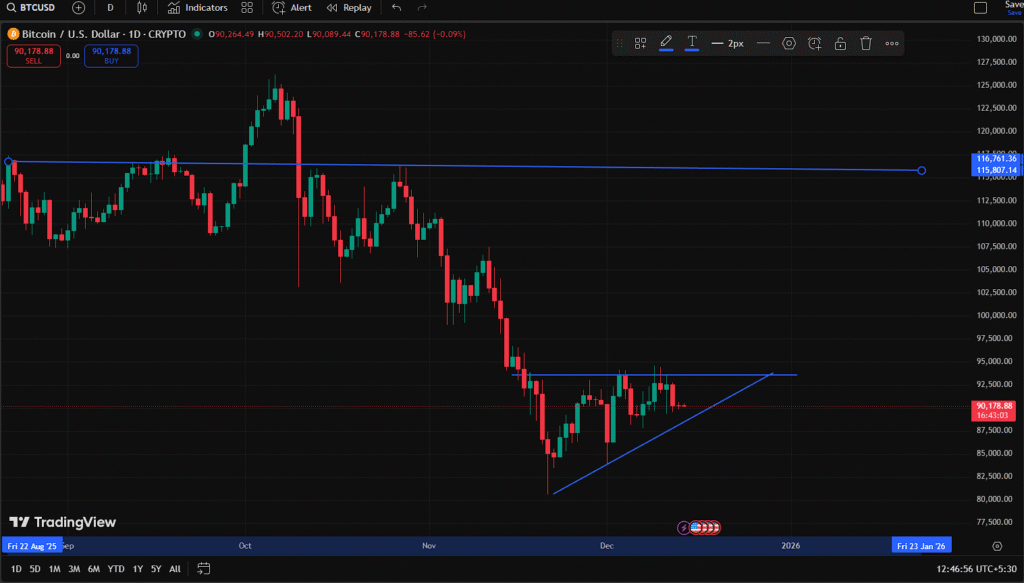
One of the most important elements visible on the Bitcoin chart is the clear resistance zone at higher levels. This zone previously acted as support, but once broken, it turned into a strong ceiling. In technical analysis, this behavior is common and powerful. When price fails to reclaim such a level, it signals hesitation and lack of confidence among buyers.

On the downside, Bitcoin has formed a temporary support zone after a steep fall. This area is where buyers have stepped in repeatedly, preventing further collapse. The presence of multiple wicks and small-bodied candles around this zone suggests accumulation rather than panic selling. In simple terms, smart money may be buying quietly while emotions remain muted.

The chart also shows a rising trendline from recent lows, forming a triangular structure. This pattern often represents indecision. Neither bulls nor bears have full control. Instead, the market is waiting for a trigger — such as macroeconomic news, institutional activity, or regulatory clarity.

Historically, Bitcoin has spent significant time in such ranges before making powerful moves. Long-term investors often see this as a test of patience. Short-term traders see risk. Emotionally, this phase separates disciplined participants from impulsive ones.

Quotes from experienced traders often highlight this stage as “the silent phase before volatility.” While the price may look boring, decisions made here shape the next trend.

Fear, Hope, and the Role of Long-Term Believers

Bitcoin is more than a trading asset; it is a belief system for millions. When price drops sharply, fear dominates headlines. When it rises, hope returns instantly. The current price action reflects a battle between these two emotions.

Long-term holders, often called “strong hands,” usually remain calm during such phases. They understand that Bitcoin has historically moved in cycles — rapid growth followed by deep corrections, and then long periods of rebuilding. The present structure fits well into that historical rhythm.

At the same time, new participants often feel uncertain. Seeing price fail to reclaim key levels creates doubt. Social media sentiment becomes divided. Some predict doom, others predict explosive rallies. The truth often lies somewhere in between.

Fundamentally, Bitcoin continues to attract institutional interest, and its limited supply remains unchanged. However, price does not move on fundamentals alone. Liquidity, interest rates, and global risk appetite play crucial roles. Until confidence returns at higher levels, Bitcoin may continue consolidating.

This phase teaches an important lesson: markets reward patience, not emotions. Those who chase price often suffer, while those who wait for confirmation survive longer.

What the Bitcoin Chart Suggests About the Road Ahead

bitcoin

Looking ahead, the Bitcoin chart suggests that a decisive move is approaching. The tightening price range indicates that volatility is building beneath the surface. A breakout above resistance could restore confidence and invite fresh buying interest. Such a move would signal that buyers are back in control.

On the other hand, failure to hold the current support zone could trigger another wave of selling. This would test the patience of long-term holders and possibly create panic among short-term traders. However, even such a move may not necessarily mean the end of Bitcoin’s story — only another chapter in its long journey.

For investors, the key lies in risk management and clarity. Blind optimism can be dangerous, but so can excessive fear. The chart does not predict the future; it reflects probability. Right now, probability suggests caution, preparation, and emotional control.

Bitcoin has always rewarded those who respect the process. Whether the next move is up or down, it will reshape sentiment once again. Until then, the market waits — quietly, patiently, and decisively.

Disclaimer: This article is for educational and informational purposes only. It does not constitute financial advice or investment recommendations. Cryptocurrency markets are highly volatile, and readers should conduct their own research or consult a qualified financial advisor before making any investment decisions.


Top 50 Crypto Coins

Sensex Slips 297 Points, Nifty Falls Below 25,150: DRL and Tata Steel Lead Losses

0

Investors always experience both excitement and fear when the stock market is volatile. Tuesday saw a minor decline in the Indian stock market once more. The Sensex and Nifty closed lower for the second straight day, reversing their opening gains. Investor sentiment was influenced by pressure from the financial sector, resulting in a cautious market sentiment.

Decline in Market Mood and Important Stocks

Sensex Slips 297 Points, Nifty Falls Below 25,150: DRL and Tata Steel Lead Losses

Key stocks, including Bajaj Finance, Bharat Electronics, Tata Steel, TCS, and NTPC, were most affected, down 1.4% to 1.8% in the 30-stock Sensex. This demonstrates unequivocally how the market as a whole was affected by pressure in financial and large-cap equities.

The pressure on small- and mid-cap indices persisted as well. The mid-cap and small-cap indices ended the day down by 0.8% and 0.9%, respectively. This suggests that negative sentiment was present in the larger market as well as large-cap stocks.

LG Electronics India Vibrant Launch

Despite not being listed on the Sensex or Nifty, LG Electronics India caused a sensation in the stock market. The company’s initial public offering (IPO) closed 48.2% higher after listing at a 50% premium. Since the 2021 Eternal IPO, this is thought to be the best listing performance of a billion-dollar IPO.

The IPO of LG Electronics India, according to experts, has increased analyst and investor confidence. In a matter of minutes, almost seven “Buy” ratings were issued. This indicates that investors are becoming more interested in India’s consumer durables market.

Pressure from the Global Market

Globally, the downturn in the Indian stock market is also being felt. Growing trade tensions between the US and China continued to put pressure on Wall Street’s major indexes.

The Dow Jones Industrial Average closed at 45,620.31, down 447.27 points, or 0.97%.

The S And P 500 closed at 6,573.41, down 81.28 points, or 1.22%.
The Nasdaq closed at 22,286.04, down 408.56 points, or 1.80%.

Pressure was also felt in Asian and European markets. The MSCI World Index was down 0.3%, and the Stoxx Europe 600 was down 0.7%. As a result, investors throughout the world are being cautious, and the market is feeling bad.

A Note to Investors

Sensex Slips 297 Points, Nifty Falls Below 25,150: DRL and Tata Steel Lead Losses

Given the current state of the market, investors should proceed with care. Market direction can be changed by events like initial public offerings (IPOs), global trade disputes, and volatility in financial equities. Although LG Electronics India’s initial public offering (IPO) is a successful example, it also shows that investment in the proper opportunities and companies can yield good returns.

Disclaimer: This article is for informational and educational purposes only. Investing in the stock market carries risks, and it is important to confirm with an authoritative source and a financial advisor before making any investment decision.

Also Read:

India’s IPO Market Set for a Historic October: 5 Billion doller Deal Frenzy Ahead

Indian Stock Market Weekly Preview: Big Triggers You Can not Miss

Buy or Sell: Expert Picks for Nifty and Bank Nifty on 6th October

Crypto Meltdown 2025: Record Losses Shake Investors and Options Markets

0

The biggest digital asset liquidation in history occurred in the cryptocurrency market last Friday, wiping away positions valued at over $19 billion. Investors have been taken aback by this shock, which goes beyond a simple figure. Massive ‘put’ buying was done on Ethereum and Bitcoin options as investors tried to protect themselves against a possible drop.

The Greatest Historical Liquidation

Crypto intelligence firms claim that this $19 billion liquidation is 19 times larger than the March 2020 pandemic crash and the 2022 FTX catastrophe, and nearly nine times larger than the February 2025 disaster.

This data makes it very evident that the drop is not straightforward. This serves as a caution to cryptocurrency investors that the market may experience abrupt and unanticipated large losses. Investor anxiety and uncertainty have increased as a result of this enormous liquidation.

Hedging is becoming more common among investors.

To guard against any future drops, cryptocurrency investors have recently started to participate in the options market. The fact that so many ‘put’ options are being bought on Ethereum and Bitcoin suggests that investors are now attempting to construct their holdings safely.

Purchasing ‘put’ options indicates that investors wish to reduce their losses in anticipation of a future decline in price. This shows apprehension and a lack of confidence over the market’s future. Large-scale hedging by investors affects pricing and market liquidity as well.

A lack of liquidity and panic selling

Panic selling was the main issue throughout this cryptocurrency crash. Investors panicked and sold their assets as big bets were liquidated. The market fall was further exacerbated by this selling.

Additionally, a lack of liquidity further complicated the situation. Prices drop precipitously when the market has more sellers than customers. This exacerbated investor anxiety and raised market turbulence.

Is a more profound decline on the horizon

Such a significant drop, according to experts, shows that the cryptocurrency market is still unstable. Extensive hedging and high panic selling are signs that investors are wary of the future.

It is also possible to argue that institutional players and big investors are currently attempting to lower their risk, which could eventually bring stability back to the market. However, looking at the current scenario, it is clear that Crypto Crash 2.0 is truly a warning bell for investors.

Message for Investors

This crash teaches us that crypto investment always comes with risks. Small and new investors should protect their investments and avoid making hasty decisions. Despite market volatility, smart investments and prudent decisions are the key to long-term security.

Vigilance, research, and risk management are crucial for investors at this time. This crash is a reminder that rapid changes are possible in the crypto market, and every step must be taken carefully.

Disclaimer: This article is for informational and educational purposes only. Investing in cryptocurrencies comes with risks. Investors should make their own decisions and invest only based on authoritative sources and the advice of a financial advisor.

Also Read:

India’s IPO Market Set for a Historic October: 5 Billion doller Deal Frenzy Ahead

Indian Stock Market Weekly Preview: Big Triggers You Can not Miss

Buy or Sell: Expert Picks for Nifty and Bank Nifty on 6th October

Bitcoin, Energy, and Elon Musk: Why the Tech Billionaire Is Watching Crypto Closely

0

Every action in the Bitcoin and cryptocurrency industry generates a fresh debate or controversy, and Elon Musk is one of the most talked-about. In 2022, Musk sold a significant amount of Tesla Bitcoin stock during the steepest drop in the cryptocurrency market. It was a long time before he discussed the digital currency in public.

Recent Interest

However, things appear to be shifting lately. Early in the morning US time, Musk replied to a post from ZeroHedge that explained the high prices of Bitcoin, silver, and gold. “Money isn’t the issue,” the message said. Governments (China and the US) will eventually finance investments in AI, which is the new global weapons competition.

The ‘debasement,’ or the issuance of counterfeit currency to finance the AI weapons race, is the reason why gold, silver, and Bitcoin are increasing so quickly. Yet, energy cannot be faked.

What is the significance of Musk interest

Musk remark suggests that he has started to see the significance of energy-based currency and Bitcoin. Although it is uncertain if Musk would resume his full activity, it is apparent that he is monitoring this “debasement trade.”

In the past, Musk has frequently made erratic decisions about cryptocurrency. His prior remarks against Dogecoin and Bitcoin on Twitter prompted the cryptocurrency market to fluctuate. As a result, it’s hard to tell if his recent comment is just a fleeting remark or the start of his future participation in conversations about investments and cryptocurrencies.

The Value of Digital Currency Based on Energy

Musk highlighted the energy-based aspect. This implies that it is impossible to counterfeit cryptocurrencies like Bitcoin. More fiat currency can be issued by governments whenever they choose, but Bitcoin needs actual energy.

Bitcoin, Energy, and Elon Musk: Why the Tech Billionaire Is Watching Crypto Closely

According to cryptoanalysts, Musk’s strategy can revive interest among investors and IT aficionados. Musk’s emphasis on this digital asset raises the possibility that he will take further action in this field in the future.

Disclaimer: This article is for informational and analytical purposes only. Investing in Bitcoin and other cryptocurrencies carries risk. It’s important to verify with an authoritative source and a financial advisor before investing.

Also Read:

Buy or Sell: Expert Picks for Nifty and Bank Nifty on 6th October

Building an Emergency Fund : Why It’s Critical in 2025’s Economic Climate

Stress-Free Tax Filing: Leveraging the Audit Deadline Extension for Smarter Compliance

India’s IPO Market Set for a Historic October: 5 Billion doller Deal Frenzy Ahead

0

Companies now have new opportunities for growth because to India’s quickly expanding economy, and initial public offerings IPO are a crucial tool in this regard. It is anticipated that October’s IPOs would raise a record $5 billion in total. Two significant firms at the forefront of this IPO wave are Tata Capital Ltd. and LG Electronics India Ltd., whose products will not only gauge investor interest but also influence the direction of the market in the months to come.

Focus on the IPOs of Tata Capital and LG Electronics

With a $1.7 billion valuation, Tata Capital’s IPO will be the biggest sale in India this year. For investors, the chance to purchase stock in the finance division of a well-known and trustworthy business such as the Tata Group is a big opportunity. International behemoths like Marshall Wace, Goldman Sachs, Morgan Stanley, and Indian mutual funds have become anchor investors in the problem. Investors have a fantastic opportunity to access India’s sizable consumer market through LG Electronics India.

The IPO market has been revitalized by domestic capital and regulatory improvements.

The power of domestic institutional investors is the largest shift observed in the Indian initial public offering (IPO) market. Large inflows into initial public offerings (IPOs) are currently being driven by retail investors’ regular SIP investments in mutual funds. As a result, the market can now readily absorb supply.

This pace has also been enhanced by regulatory reforms. Recently, the Reserve Bank of India loosened restrictions on loans to investors taking part in initial public offerings (IPOs), and the Securities and Exchange Commission of India made it easier for big private companies to list. Large offerings now have a solid base thanks to these actions.

Historical Insights and the Current Trend for the Upcoming Weeks

However, some firms’ listings have fallen short of expectations, based on the history of huge initial public offerings. The shares sank 7% on the first day after Hyundai Motor India’s historic $3.3 billion initial public offering. In the past, when big businesses like LIC and Paytm went public, investors were let down. For this reason, investors are closely examining Tata and LG’s offers to determine if these significant problems can buck the trend.

India’s IPO Market Set for a Historic October: 5 Billion doller Deal Frenzy Ahead

The Tata Capital initial public offering (IPO) is scheduled to open from October 6 to October 8 and go live on October 13. The offering by LG Electronics India will open from October 7 to October 9 and make its stock exchange debut on October 14. The depth of the Indian capital market and investor demand would be put to the test in both cases.

Disclaimer: This article is for informational purposes only. The financial information provided here should not be construed as investment advice. Please consult your financial advisor and verify information with authoritative sources before making any investment decisions.

Also Read:

Personal Finance Building an Emergency Fund : Why It’s Critical in 2025’s Economic Climate

Stress-Free Tax Filing: Leveraging the Audit Deadline Extension for Smarter Compliance

Dow Jones Nears a Critical Breakout: Is the Rally Just Getting Started?

Indian Stock Market Weekly Preview: Big Triggers You Can not Miss

0

For Indian stock market investors, the upcoming week may be pivotal. The market saw a robust comeback on Monday, reversing its earlier dip. Both the Sensex and Nifty closed at higher prices as a result of strong buying in the banking and metals sectors. The Nifty increased by almost 57 points to close at 24,894, while the Sensex gained almost 223 points to surpass 81,200. Following the previous sell-off, the market is breathing easier thanks to this rally.

The Indian Stock Market is focused on the Q2 results

With the start of the Indian stock market quarterly results season, all eyes are on the titans of the IT industry. Investor interest will be piqued when Tata Consultancy Services (TCS) releases its Q2 FY26 earnings on October 9. After a muted performance in the first quarter due to uncertainties around tariffs, the IT sector is anticipated to record negative second-quarter results. Additionally, the industry has been under additional strain due to the recent hike in H1B visa fees in the US, which has made the overall situation seem fairly difficult.

IPO Market to Heat Up

IPO activity in the primary market is expected to remain robust next week. Investors are eyeing large public issues like Tata Capital and LG Electronics, which are scheduled to open for subscription next week. The IPO Indian Stock Market has seen strong participation in recent months, and investors are hopeful that upcoming issues may also deliver strong listing gains. This is likely to increase liquidity in the market and boost investor sentiment.

International Attention to FOMC Minutes

This week is also planned for a significant worldwide event. The minutes of the October 8th meeting of the US Federal Reserve will be made public. The Federal Open Market Committee (FOMC) recently lowered its benchmark interest rate to a range of 4% to 4.25% during its September 16–17 meeting. This was 2025’s first rate cut. The Fed had previously held interest rates steady for nine months in a row. Since they have the potential to indirectly affect both the direction of the Indian Stock Market and global capital flows, the signals given in these minutes will be very important to the market.

Market Confidence Is Increased by Sectoral Performance

Indian Stock Market Weekly Preview: Big Triggers You Can not Miss

Strong investor interest in equities like Tata Steel, Hindalco, and JSW Steel propelled Monday’s market bounce. Strong increases were also made by private banks like Axis Bank and Kotak Mahindra Bank. Strong purchasing was also observed in PSU banks, which improved the mood of the market as a whole.

Disclaimer: This article is for informational purposes only. The information provided here should not be construed as investment advice. Consult your financial advisor before investing and keep an eye on the latest market updates.

Also Read:

Dow Jones Nears a Critical Breakout: Is the Rally Just Getting Started?

Bitcoin Price Analysis: Can BTC Maintain Its Momentum Above $115,000?

Dow Jones Struggles Below 46,000 as Market Awaits Next Catalyst: Technical and Fundamental Outlook

Buy or Sell: Expert Picks for Nifty and Bank Nifty on 6th October

0

Nifty: The Indian stock market recovered well last week over the holiday season. Despite a drop at the start of the week, the market was revived by strength in the banking and metal sectors. There is now a fresh sense of enthusiasm among investors. Ganesh Dongre, Senior Manager, Technical Research, Anand Rathi, suggests purchasing three specific stocks on Monday, October 6, 2025, in light of this situation.

Bank and Nifty. The Nifty’s strength increases investor confidence

The Nifty 50 saw a weekly rise of 0.97% last week, closing at 24,894. In the meantime, there were notable advances of 2 to 5 percent in the midcap and smallcap indices. The Reserve Bank of India (RBI) maintained its neutral policy stance and the repo rate at 5.5% during its monetary policy meeting on October 1. In order to emphasise India’s excellent balance between growth and inflation, RBI Governor Sanjay Malhotra increased the FY26 GDP growth prediction to 6.8%. Investor trust in the market was further bolstered by this.

Bank Nifty was scrutinised; PSU banks and NBFCs performed well.

Last week, the Bank Nifty was also able to stay above the 54,000 mark. While the 56,000–57,000 area is a crucial resistance zone, the 53,500–54,000 range is regarded as solid support. Stable RBI policies have supported the strength of PSU banks and NBFCs. The stock market may resume its upward trajectory if the Bank Nifty makes a clear move above the 57,000 barrier in the upcoming week.

Three Robust Stocks to Keep an Eye on Next Week

This week, Ganesh Dongre advises investors to focus especially on three equities. First, with a target price of Rs179 and a stop loss of Rs165, Tata Steel is regarded as a buy at the Rs170–172 levels.

Buy or Sell: Expert Picks for Nifty and Bank Nifty on 6th October

Adani Green is the second stock market, and it is advised to purchase it between Rs 1060 and Rs 1070. A target price of Rs1150 and a stop-loss of Rs1020 have been established.

Disclaimer: This article is for informational purposes only. Any stock recommendation contained herein does not constitute investment advice. Investing in the stock market is subject to risks. Consult your financial advisor before investing.

Also Read:

Bitcoin Faces Resistance at $117K While Holding Above $115K: Market Analysis and Outlook

Dow Jones Nears a Critical Breakout: Is the Rally Just Getting Started?

Bitcoin Price Analysis: Can BTC Maintain Its Momentum Above $115,000?

Building an Emergency Fund : Why It’s Critical in 2025’s Economic Climate

78

In 2025, economic uncertainty continues to challenge individuals and families worldwide. Inflation pressures, unstable job markets, and rising living costs underscore the urgent need for financial security. Building an emergency fund has become more crucial than ever—it acts as a financial safety net that cushions against unexpected hardships, preserves your financial goals, and provides peace of mind in turbulent times.

Why an Emergency Fund Matters More Than Ever in 2025

Economic fluctuations in 2025 have made managing finances increasingly complex. Household budgets face pressure from rising prices of essentials such as food, fuel, and healthcare. Simultaneously, employment landscapes are shifting, with gig work, contract jobs, and market uncertainties impacting income stability. Against this backdrop, the significance of an emergency fund cannot be overstated.

An emergency fund serves as a dedicated reserve to cover sudden, unanticipated expenses. These might include urgent medical bills not fully covered by insurance, urgent home repairs like plumbing or electrical failures, or even a temporary loss of income due to layoffs or business downturns. Without such a cushion, many face the grim reality of turning to high-interest credit cards or expensive loans, which only deepen financial strain. An emergency fund safeguards you from such debt traps and preserves both tangible assets and mental well-being.

How Much Should You Save?

The rule of thumb commonly suggested by financial experts is to save between three to six months’ worth of essential living expenses. However, in today’s unpredictable environment, some advisors recommend aiming even higher, such as six to twelve months, especially for those with variable income or in industries subject to frequent disruptions.

The calculation begins with listing all necessary monthly expenses—housing costs, utilities, groceries, transportation, healthcare, debt payments, and insurance premiums. Multiplying this by the desired number of months creates a clear target. For example, if your essential monthly expenses total $3,000, a six-month emergency fund would be $18,000.

Personal circumstances influence this number. Families with young children, individuals with chronic health conditions, or those with a single income source often require larger buffers. Conversely, dual-income households with stable employment may find three months sufficient initially. The key is to tailor the goal responsibly and revisit it periodically to adjust for changes in lifestyle or economic conditions.

Building Your Fund: Steps to Success

Creating or replenishing an emergency fund amidst financial obligations can feel daunting, but gradual, disciplined efforts build strong foundations:

  • Set a clear, attainable goal: Begin by determining your monthly essential expenses and decide realistically how many months you want to cover. Break this larger target into smaller milestones so progress feels achievable and motivating.
  • Automate your savings: Arrange automatic transfers from your paycheck or checking account into a separate savings vehicle. This “pay yourself first” approach keeps you consistent and reduces the temptation to dip into your emergency stash prematurely.
  • Reduce discretionary expenditures: Review your spending habits to identify non-essential costs such as frequent dining out, luxury subscriptions, or impulse purchases. Redirect these funds toward your emergency savings. Over time, even modest savings add up significantly.
  • Choose accessible, safe accounts: Your emergency savings should be kept in liquid, low-risk accounts—high-yield savings accounts or money market accounts are preferred. These provide easy access in times of need without penalizing early withdrawals or exposing your principal to market fluctuations. Avoid tying up emergency funds in volatile investments or long-term deposits with penalties.
  • Regularly review and replenish: Whenever you draw from your emergency fund, prioritize replenishing it as soon as possible. Economic realities and your financial goals evolve, so periodically reassess your target amount to keep pace with changing needs.

The Emotional and Financial Impact

The value of an emergency fund extends far beyond numbers. Psychologically, it provides reassurance and reduces anxiety, allowing individuals to focus on addressing emergencies rather than worrying about financial survival. In stressful situations, this cushion fosters mental clarity, enabling better decision-making and more measured responses.

Financially, an emergency fund protects against spiralling debt. It prevents the hasty use of credit cards or loans with exorbitant interest rates, which can trigger long-term financial damage. Furthermore, by preserving other investment accounts and retirement funds from early withdrawals, it safeguards your future financial health.

This fund is not merely a bucket of money but a source of empowerment. It imparts confidence to face challenges, knowing you have a foundation to lean on and mitigating the fear of uncertainty.

Top 50 Crypto Coins

Also Read

India’s IPO Market Set for a Historic October: 5 Billion doller Deal Frenzy Ahead

Indian Stock Market Weekly Preview: Big Triggers You Can not Miss

Stress-Free Tax Filing: Leveraging the Audit Deadline Extension for Smarter Compliance

12,589

In today’s complex financial environment, regulatory deadlines like audit filings are more than just dates on a calendar—they represent trust, transparency, and credibility. Yet, deadlines often bring intense pressure for businesses and professionals alike, resulting in last-minute work, stressful team coordination, and the risk of inaccuracies. The recent extension of the audit filing deadline has created a crucial window of opportunity. Instead of merely treating it as a few extra days, this extension can be turned into a strategic advantage to ensure smoother compliance, better accuracy, and improved planning.

Turning Compliance into Strategic Preparation

Too often, tax filing happens under time pressure and is treated as a tick-box exercise. This rushed approach leaves room for discrepancies and exposes businesses to regulatory risks. By leveraging the extension, organizations can transform filing from a reactive ritual into an exercise of financial strengthening. Starting early allows finance teams to carefully review key data, validate supporting documentation, and address any inconsistencies well before submission. This shift also helps in reallocating internal resources smartly—ensuring multiple teams (finance, operations, and legal) don’t work under extreme pressure. Ultimately, this proactive approach elevates compliance from a burden into a forward-looking capability.

Key Advantages of the Extension

  • Error minimization: Extra time serves as protection against unintentional errors that often creep in during hurried filings. Numbers can be double-checked, mismatched entries reconciled, and past discrepancies corrected before they escalate into notices or penalties. For instance, businesses managing multiple branches can use this period to ensure consolidated statements are in order and free of oversight. A careful review now prevents unnecessary litigation or unwelcome audits later.
  • Enhanced financial insights: Beyond compliance, this opportunity allows businesses to uncover patterns in their financial data. A deeper evaluation may reveal underutilized deductions, overlooked incentives, or even inefficiencies in cash flows. For example, firms may identify tax benefits on capital investments or optimize depreciation claims which were previously ignored due to time constraints. By spending quality time with the numbers, companies gain both immediate tax advantages and longer-term financial clarity.
  • Stronger professional collaboration: With the pressure of tight deadlines eased, conversations with chartered accountants, auditors, and consultants can shift from transactional to strategic. Advisors can spend more time suggesting industry-specific tax-saving methods or helping businesses plan for upcoming regulatory changes. For companies with international operations, professionals may even advise on cross-border implications and compliance planning—something that typically gets sidelined when time is short.
  • Reduced organisational stress: A stretched deadline directly impacts workplace well-being. Teams usually work overtime in audit season, increasing stress and the possibility of burnout. By approaching the process more systematically, organisations not only reduce pressure on their finance departments but also create space for better collaboration with other internal teams. When employees are less stretched, the overall quality of work improves significantly, ensuring robust compliance as well as higher morale.

How Businesses Can Utilize the Extra Time

  • Early initiation: Waiting until the extended deadline approaches cancels out the benefits of the extension. Organizations should begin preparations now, treating the new timeline as a safeguard rather than a reason to delay. Early movers will also enjoy smoother interactions with auditors and consultants, who are typically overwhelmed with last-minute client rush just before the actual due date.
  • Structured document management: Tax filing is data-driven and document-heavy. From investment records and bank statements to loan agreements and expense vouchers, paperwork must align precisely with declarations made in filings. Businesses now have an opportunity to digitize, classify, and centralize these documents for easy access. Adopting systematic documentation practices not only eases audit compliance but also builds more resilient internal record-keeping systems that serve companies well in the long term.
  • Engage professional advisors effectively: Chartered accountants, auditors, and consultants are better positioned to provide in-depth advice in this extended window. Engaging with them early means they can identify weak spots, advise on tax-saving strategies, and even guide restructuring decisions to improve the company’s overall efficiency. Detailed discussions with experts can help businesses avoid costly compliance mistakes and explore new opportunities for optimization.
  • Plan ahead: Filing obligations should not be seen in isolation. This extension can be used as a platform for forward-looking financial planning. Businesses can map projected cash flows, evaluate tax-saving investments, and align compliance with growth strategies. For example, emerging companies may use this time to plan for expansion-related tax implications, while established firms might review their retirement liability provisioning. The key is to step beyond filing as a deadline and use it as a stepping stone toward future readiness.

Shaping a Stronger Compliance Culture

One of the hidden benefits of the extension is its ability to reshape corporate culture around compliance. In many firms, filing seasons are associated with stress, urgency, and firefighting. By shifting to a proactive and organized approach, businesses signal to employees and stakeholders that they prioritize governance, predictability, and resilience. Over time, this cultural shift reduces compliance-related disruptions and drives greater financial discipline across the organization. It replaces short-term anxiety with long-term stability.

Read More

Dow Jones Nears a Critical Breakout: Is the Rally Just Getting Started?

Dow Jones Nears a Critical Breakout: Is the Rally Just Getting Started?

43

In the ever-changing world of stock markets, some days feel like just another tick on the chart—but today isn’t one of them.

The Dow Jones Industrial Average (DJIA) is making headlines again, and if you’re an investor, trader, or someone just curious about where the markets are heading, now is a great time to tune in. Let’s break it down in simple terms—no fancy jargon, just clear insights.

What’s Happening on the Chart?

The Dow is currently trading around 46,238, brushing shoulders with recent highs and showing strong signs of bullish momentum. That’s a good sign for the bulls.

We can see a strong uptrend forming after a period of consolidation. The market broke out above key resistance zones and is now comfortably sitting above those levels, hinting at potential further gains.

Here’s what really stands out:

Bollinger Bands Signal Expansion

The Bollinger Bands are widening, especially on the upper side. This usually means increased volatility—and when prices hug the upper band, it’s a classic sign of strong buying pressure.

Strong Support Levels

Two key support levels are marked:

  • 45,702 (middle Bollinger Band/SMA)
  • 45,076 (lower support zone)

If the Dow were to pull back, these zones might act as strong buying areas, giving the bulls a chance to regroup and charge ahead.

Consistent Green Candles

The recent daily candlesticks have been largely bullish, with multiple green candles showing steady gains. This speaks to investor confidence and suggests that the momentum is still in favor of the upside.

The Technical Picture: What It’s Telling Us

If you’re someone who watches the markets technically, here’s what you’ll love:

  • Price is above the 20-day SMA, which is bullish.
  • The upper Bollinger Band is being tested, often a precursor to either a breakout or short-term pullback.
  • Recent price action is forming higher highs and higher lows, a textbook definition of an uptrend.

So yes, the Dow might just be gearing up for another leg higher.

What Should Traders and Investors Watch?

Here are a few simple, practical takeaways:

  • Watch for a clean breakout above 46,336 (recent resistance). If it holds, we could see a rally toward new highs.
  • If price dips, check how it behaves near 45,702 or 45,076—these could be prime buying spots.
  • Volatility is rising, so position sizing and risk management are key. Don’t overextend, especially if markets get choppy.

Final Thoughts

The Dow Jones Industrial Average is flashing some very encouraging technical signals right now. Whether you’re an investor looking for confidence or a trader waiting for a breakout, there’s something here for everyone.

The markets are emotional—and so are we. But this is where emotion meets strategy. Stay informed, stay alert, and always have a plan.

Disclaimer:

This article is for informational purposes only and should not be considered financial advice. Always consult with a certified financial advisor or do your own research before making investment decisions. Markets involve risk, and past performance is not indicative of future results.

Top 50 Crypto Coins

Bitcoin Price Analysis: Can BTC Maintain Its Momentum Above $115,000?

1,191

Introduction

Bitcoin has once again captured the spotlight as traders and long-term investors closely watch its movements around the $115,000 mark. In recent sessions, the cryptocurrency giant has shown both resilience and volatility, keeping the market on its toes. With price fluctuations between $110,000 and $117,000, the big question remains: can Bitcoin maintain this momentum, or is a correction on the horizon? This article dives into the latest price action, technical indicators, and market sentiment to give a detailed outlook on Bitcoin’s current position.

Bitcoin Struggles to Hold Ground Above $115,000

Bitcoin’s price chart for September highlights an intense battle between buyers and sellers. After touching a recent high near $117,000, the cryptocurrency pulled back slightly but has managed to stay above the $115,000 support level for now. This zone has emerged as a crucial psychological level for traders.

Bitcoin price consolidating above $115,000 amid market uncertainty.

The Bollinger Bands indicator on the daily chart shows tightening ranges, suggesting that the market may soon witness a sharp move. While the price has been trading close to the upper band, the recent candles reveal hesitation, with red bars signaling selling pressure. The 20-day moving average (SMA), currently at around $111,581, is providing solid support from below. This means that if Bitcoin breaks below this level, we could see a deeper correction.

The buying volumes have softened compared to early September, when BTC surged aggressively from the $110,000 zone. This cooling-off phase is not unusual after strong rallies, but it leaves room for speculation. Will the bulls regain strength to push above $117,000, or are bears preparing to drag Bitcoin back towards $111,000?

Technical Analysis: Key Levels and Indicators

Technical indicators currently provide a mixed picture. On one hand, Bitcoin’s strong rebound earlier this month showed the presence of determined buyers, particularly when it bounced sharply from lows of $110,000. On the other hand, the recent struggle around $115,000 suggests fatigue among bulls.

The 50-day moving average, which is still trending upward, shows that the long-term momentum remains intact. Analysts point out that staying above the 50-day SMA is critical to preserve the bullish narrative. Meanwhile, the Relative Strength Index (RSI) is hovering in a neutral zone, signaling neither overbought nor oversold conditions.

A key support zone lies around $111,000, coinciding with the lower range of recent price action. If Bitcoin breaks below this, the next stop could be the psychological $110,000 barrier. On the upside, resistance remains firmly planted at $117,000. Breaking this barrier with high volume could open the doors to $120,000 and beyond.

Historically, September has been a tricky month for Bitcoin, often marked by heightened volatility. This year seems no different, as traders balance optimism about long-term adoption with caution around short-term corrections.

Market Sentiment: Traders Stay Cautious Yet Hopeful

Beyond charts and indicators, market sentiment plays a huge role in Bitcoin’s performance. Currently, sentiment appears cautious but not overly bearish. Social media discussions highlight mixed views—some traders expect a breakout above $120,000 soon, while others warn of a potential pullback to $110,000.

Market participants closely monitor Bitcoin’s consolidation phase.

A recent survey of retail traders suggests that around 60% remain optimistic about Bitcoin’s potential to hold above $115,000, citing long-term bullish fundamentals like institutional adoption and growing interest in Bitcoin ETFs. Meanwhile, professional traders emphasize patience, noting that the consolidation phase could last until early October.

Institutional investors, often dubbed the “smart money,” are also carefully watching these levels. Data from crypto derivatives platforms shows a rise in options activity, particularly with strike prices around $120,000. This indicates that large players are preparing for potential volatility, either upward or downward.

Adding to the uncertainty are global macroeconomic factors. With inflation concerns lingering and central banks maintaining cautious monetary policies, Bitcoin continues to be viewed as a hedge by some and a risky asset by others. The balance between these perspectives will likely shape the next big move.

The Road Ahead: Can Bitcoin Break Past $120,000?

Looking ahead, the most critical question is whether Bitcoin can break through the $117,000–$120,000 resistance zone. Historically, breaking such levels often fuels a wave of FOMO (fear of missing out) among retail traders, leading to rapid price surges.

If Bitcoin clears this resistance convincingly, the next target could be $125,000 or even higher in the medium term. Analysts suggest that a combination of positive news, strong volumes, and institutional interest would be needed for such a rally.

On the flip side, failure to break above $117,000 could see Bitcoin revisiting lower levels. A drop below $111,000 would put $110,000 at risk, and breaching that could spark further downside pressure toward $107,000.

The cryptocurrency market thrives on narratives, and Bitcoin’s current narrative is one of cautious optimism. As long as it stays above the 20-day moving average and maintains its broader uptrend, bulls will retain the upper hand. However, traders should remain prepared for short-term volatility, as corrections are part and parcel of any strong uptrend.

Conclusion: A Defining Moment for Bitcoin

Bitcoin’s consolidation around $115,000 is shaping up to be a defining moment for the cryptocurrency. The coming days and weeks will test the strength of bulls and the patience of traders. Whether it breaks higher toward $120,000 or dips back toward $110,000, one thing is certain—volatility will remain Bitcoin’s closest companion.

For long-term investors, such fluctuations are often viewed as opportunities to accumulate. For short-term traders, however, this is a time to remain vigilant, follow key support and resistance levels, and avoid over-leveraging in an unpredictable market.

Disclaimer

This article is for informational purposes only and should not be considered financial advice. Cryptocurrency investments are highly volatile and carry significant risk. Readers are encouraged to conduct their own research or consult a professional financial advisor before making investment decisions.

Read More

Top 50 Crypto Coins

SpaceX’s Starship Explodes During Test at Starbase Facility in Texas

Dow Jones Struggles Below 46,000 as Market Awaits Next Catalyst: Technical and Fundamental Outlook

7,255

Introduction

The Dow Jones Industrial Average (DJI) closed lower at 45,712 on Tuesday, down 170 points (-0.37%), as investors weighed economic signals, earnings reports, and global developments. After attempting to push past the 46,124 resistance level, the index retraced, testing support near 45,700. With technical indicators showing consolidation and traders awaiting fresh catalysts, the Dow’s near-term trajectory remains uncertain. This article explores the key technical levels, market sentiment, and macroeconomic forces driving the Dow, offering insights into what investors should expect next.

Dow Jones Price Action and Technical Indicators

The daily candlestick chart reveals that the Dow recently tested the upper Bollinger Band near 46,124 before facing selling pressure, pulling back toward the mid-band. The index closed at 45,712, slightly below the critical 45,789 support zone.

The 20-day Simple Moving Average (SMA) is currently at 45,478, offering additional support, while the lower Bollinger Band sits at 44,832, marking a potential downside target if selling accelerates. Resistance remains strong at 46,124, which the index failed to break in the last three sessions.

Market analysts suggest that a sustained move above 46,124 would signal renewed bullish momentum, possibly pushing the Dow toward 46,500. However, failure to defend the 45,700–45,478 zone could trigger a deeper correction toward 45,076, where historical support lies.


Caption suggestion: Dow Jones faces resistance at 46,124 while testing support around 45,700.

Short-Term Trends Suggest Sideways Movement

The Dow’s recent candles indicate indecision, with long wicks on both sides reflecting strong tug-of-war between buyers and sellers. Trading volume has moderated, suggesting that institutional investors are waiting for clearer signals before committing heavily.

Technical indicators show mixed signals. The Relative Strength Index (RSI) is near the neutral 50 level, suggesting neither overbought nor oversold conditions. The Bollinger Bands are moderately wide, hinting at potential volatility in the near term.

A senior market strategist noted:

“The Dow has struggled to hold above 46,000 despite multiple attempts. This shows profit-taking at higher levels. Unless a strong economic catalyst emerges, sideways consolidation remains likely.”

The consolidation phase could persist through September, especially as investors await updates from the U.S. Federal Reserve and key corporate earnings announcements.

Macroeconomic Forces Shaping the Dow’s Outlook

Beyond technical signals, the Dow is heavily influenced by macroeconomic developments. The Federal Reserve’s stance on interest rates remains a central driver. With inflation data cooling but not yet at target levels, speculation is growing around a potential rate cut later this year.

Any dovish commentary from Fed officials could provide a tailwind for equities, helping the Dow attempt another breakout above 46,124. Conversely, hawkish tones or stronger-than-expected economic data could limit upside momentum.

Geopolitical risks also loom large. Recent tensions in global trade, combined with energy price volatility, are adding layers of uncertainty. Meanwhile, U.S. corporate earnings have been mixed—financial and tech firms have generally outperformed expectations, while industrial and consumer-facing companies show signs of margin pressure.

Investors are also watching global markets, particularly Europe and Asia, for cues. A slowdown in global growth could spill over into U.S. equities, putting additional pressure on the Dow.

Future Outlook: Breakout or Breakdown Ahead?

The Dow’s immediate future hinges on its ability to reclaim the 46,124 resistance level. If bullish momentum returns, the index could target 46,500 and possibly new highs by early Q4. Strong economic data, upbeat earnings, or dovish Fed commentary could provide the needed push.

However, risks remain tilted to the downside if the index fails to defend the 45,700 and 45,478 support zones. In such a case, the Dow could slip to 45,076 or even retest the 44,832 Bollinger Band support.

Longer-term, the Dow remains in an uptrend, supported by strong corporate balance sheets, resilient consumer demand, and a gradual cooling of inflation. But in the short term, volatility is likely to remain elevated, requiring traders to closely watch daily closing levels for direction.

Conclusion

The Dow Jones Industrial Average is caught between resistance at 46,124 and support near 45,700, signaling consolidation amid investor caution. With the Federal Reserve, earnings season, and geopolitical factors all influencing sentiment, the index is poised for a potentially decisive move in the weeks ahead. Whether it breaks out or pulls back, the outcome will set the tone for broader equity markets as Q4 approaches.

Disclaimer: This article is for informational purposes only and should not be considered financial advice. Equity investments are subject to risks, and investors should consult with financial advisors before making decisions.

Bitcoin Faces Resistance at $117K While Holding Above $115K: Market Analysis and Outlook

Read More

India’s IPO Market Set for a Historic October: 5 Billion doller Deal Frenzy Ahead

Bitcoin Faces Resistance at $117K While Holding Above $115K: Market Analysis and Outlook

817

Introduction

Bitcoin (BTC) is witnessing heightened volatility as it hovers around the $115,000 mark, a key psychological level for traders and investors. After a sharp rally earlier this month, BTC now faces resistance at $117,000 while maintaining support near $112,000. The cryptocurrency market is at a crucial juncture, with investors closely watching whether Bitcoin can break above its current ceiling or retrace towards lower support zones. This article provides an in-depth look at the latest BTC/USD trends, technical indicators, and market sentiment, highlighting what could shape the digital asset’s trajectory in the coming weeks.


Bitcoin Price Action Shows Signs of Consolidation

Bitcoin’s recent movement suggests a consolidation phase after testing the $117,364 resistance level, which aligns with the upper Bollinger Band on the daily chart. On September 13–15, BTC briefly touched $116,000 before retracing slightly, closing near $115,003. The candlestick patterns over the last few sessions indicate indecision, with bulls attempting to push higher but facing strong selling pressure near $117K.

The 20-day Simple Moving Average (SMA) stands at $112,202, offering near-term support, while the 50-day SMA is trending lower but catching up with the rally. A break above $117,500 could trigger another bullish run toward $120,000 and beyond. However, failure to hold above $115,000 might invite fresh selling, potentially dragging BTC back to $112,000 or even $107,500, a strong historical support level.


Caption suggestion: Bitcoin (BTC/USD) faces resistance near $117,000 while consolidating around $115,000.


Key Technical Insights and Market Indicators

The Bollinger Bands, which currently show the upper limit near $117,364 and the lower band at $107,039, highlight Bitcoin’s current volatility. The narrowing bands compared to early September suggest reduced price swings, pointing toward consolidation before a potential breakout.

Volume analysis also indicates waning momentum, with recent sessions showing declining trading volumes compared to the earlier bullish surge. Typically, this means traders are waiting for a decisive move before committing to new positions.

According to market analysts, Bitcoin’s ability to sustain above $115,000 is critical. A well-known crypto strategist recently commented:

“BTC’s short-term path is determined by whether it can defend $115K convincingly. If the bulls fail here, we could see a swift test of $112K support.”

Historically, September has been a volatile month for Bitcoin, often marked by profit-taking and sideways action before October ushers in stronger bullish trends. Long-term investors remain confident, but short-term traders are exercising caution.


Institutional Demand and Macro Factors Drive Sentiment

Beyond technical indicators, Bitcoin’s price is increasingly tied to broader macroeconomic trends and institutional involvement. With global equity markets stabilizing after recent volatility, digital assets like Bitcoin are once again in focus as a hedge against inflation and currency devaluation.

Major institutions have been slowly increasing their exposure. Reports suggest that asset managers are allocating small but growing percentages of their portfolios to Bitcoin ETFs, contributing to liquidity and stability. Meanwhile, macroeconomic factors such as U.S. Federal Reserve rate-cut expectations continue to play a pivotal role in shaping sentiment.

At the same time, Bitcoin mining activity remains strong, with hash rates reaching near-record highs. This signals confidence from miners despite recent corrections. Historically, robust network fundamentals often precede long-term bullish rallies.

Analysts also highlight that geopolitical tensions and currency weakness in some emerging markets are pushing investors toward Bitcoin as a “digital gold.” As such, even if short-term price action remains choppy, the underlying demand narrative continues to build.


Future Outlook: Bullish Breakout or Deeper Correction?

Looking ahead, Bitcoin’s next major move hinges on whether it can decisively clear the $117,500 resistance level. If successful, the momentum could quickly carry BTC to $120,000 and potentially $125,000, which would represent fresh highs in the current cycle.

On the flip side, a failure to defend $115,000 may see Bitcoin testing the $112,000 support, with further downside risk toward $107,500. Traders are closely monitoring the daily close levels to gauge strength.

From a long-term perspective, Bitcoin remains in a strong uptrend. The higher-lows pattern formed since late August reflects accumulating demand. Additionally, the broader adoption of Bitcoin ETFs, regulatory clarity in the U.S., and increasing global demand provide strong fundamental support for future price growth.


Conclusion

Bitcoin’s price action near $115,000 is shaping up to be a defining moment for the cryptocurrency market this September. While short-term volatility is likely to continue, the long-term trend remains constructive. Traders must watch the $117,500 resistance and $112,000 support closely as Bitcoin prepares for its next major move. Whether it breaks higher or corrects lower, the outcome will set the tone for Q4 2025.


Disclaimer: This article is for informational purposes only and does not constitute financial advice. Cryptocurrency investments are highly volatile and carry significant risks. Investors should conduct their own research or consult a financial advisor before making decisions.

Top Crypto Coins

Dow Jones Holds Ground Near 46,000 as Investors Eye Economic Data and Fed Outlook

2,218

The Dow Jones Industrial Average (DJIA) continues to trade near the 46,000 mark, reflecting resilience in the U.S. equity market amid mixed global signals. On September 15, 2025, the index closed at 45,889.24, up by 55.02 points (+0.12%), supported by stronger-than-expected economic data and investor optimism over potential interest rate adjustments. While the market remains cautiously bullish, volatility persists as traders closely monitor Federal Reserve commentary, inflationary pressures, and global macroeconomic shifts.


Technical Signals Suggest Dow’s Strong Support Around 45,000

The Dow Jones chart indicates a key support zone forming near 45,000, a level that has held firm through multiple tests in recent weeks. The index is also trading above its 20-day simple moving average (SMA), which currently sits around 45,438, signaling sustained bullish momentum. Bollinger Bands reveal tightening volatility, suggesting that a significant breakout or correction could be imminent.


Technical chart of the Dow Jones Industrial Average showing support near 45,000 and resistance around 46,100.

For investors, this technical setup highlights the importance of the 45,000 support level. If breached, it could trigger downside momentum toward 44,500, whereas a sustained move above 46,120 may open the path for fresh record highs. Analysts emphasize that short-term consolidation within this band may define the index’s trajectory ahead of the Federal Reserve’s policy meeting later this month.

Moreover, market participants are also paying attention to trading volumes. Lower-than-average activity in recent sessions signals cautious sentiment, but institutional investors remain selectively bullish on sectors such as technology, financials, and energy, which have shown relative strength despite macroeconomic uncertainties.


Market Optimism Balances Rate Cut Speculation and Economic Headwinds

Investors are increasingly betting that the Federal Reserve may adopt a softer stance on monetary policy. Jerome Powell’s recent remarks hinting at a possible rate cut later this year have lifted risk appetite. However, analysts remain divided on whether the Fed will prioritize inflation control or support growth amid slowing global demand.

On the economic front, U.S. labor market data continues to show resilience, with unemployment holding near multi-decade lows. Retail sales have also surprised on the upside, reinforcing the idea that consumer spending remains strong. At the same time, inflation has moderated but not yet fallen back to the Fed’s 2% target, which complicates policy decisions.

Global factors are also influencing the Dow. Concerns over sluggish growth in China, geopolitical tensions in Eastern Europe, and fluctuating oil prices are contributing to market volatility. Nevertheless, U.S. equities remain one of the most attractive options for global investors seeking stability and growth potential.

In an interview with Bloomberg, a senior strategist at Goldman Sachs commented:

“The Dow’s resilience near 46,000 reflects confidence in U.S. corporate earnings and the belief that monetary policy will eventually shift in favor of equities. However, risks remain, and we advise caution as volatility could spike in the coming weeks.”

This cautious optimism is echoed by many traders who expect a volatile but upward bias in equities, provided macroeconomic conditions do not deteriorate sharply.


Earnings Season Brings Renewed Confidence

Another factor supporting the Dow has been strong corporate earnings. Several blue-chip companies have beaten analyst expectations, especially in the technology and healthcare sectors. Firms like Microsoft, Apple, and Johnson & Johnson have delivered better-than-expected revenue and profit growth, thanks to strong consumer demand and global expansion strategies.

Even industrial giants such as Caterpillar and Boeing, which faced headwinds earlier this year, have shown signs of recovery, providing a broad-based lift to the index. Earnings guidance for Q4 remains mixed, but the general sentiment leans toward cautious optimism

For investors, this earnings strength reinforces the narrative that U.S. corporations remain agile in navigating inflationary pressures, supply chain disruptions, and currency fluctuations. Analysts suggest that continued earnings growth could push the Dow toward 47,000 by year-end, provided external shocks remain limited.

However, not all companies are equally benefiting. Consumer discretionary stocks face margin pressures due to rising input costs, while some financial institutions are preparing for slower loan growth if the Fed cuts interest rates too aggressively. These divergences highlight the importance of sectoral analysis when navigating the market at current levels.


Global and Domestic Risks Could Test Market Stability

Despite the bullish tone, several risks loom over the Dow’s near-term performance. Global markets remain volatile, with Europe facing energy supply concerns and Asia grappling with slower growth. The ongoing trade tensions between the U.S. and China continue to influence market sentiment, particularly in the technology and semiconductor sectors.

Domestically, political uncertainty around fiscal policy and government spending could also weigh on markets. The upcoming U.S. elections are expected to intensify debates over taxation, regulation, and social programs, potentially affecting investor sentiment.

In addition, bond yields have shown heightened volatility. The 10-year U.S. Treasury yield recently rose above 4.3%, sparking concerns about tighter financial conditions. While equity markets have largely shrugged off these moves so far, sustained upward pressure on yields could limit stock market gains.

These risks underline why many institutional investors are maintaining a balanced portfolio approach, diversifying across equities, fixed income, and commodities. Analysts at JPMorgan noted in a recent report:

“While the Dow has shown resilience, we remain cautious about overexposure at current levels. Hedging strategies remain essential as market conditions could shift rapidly if inflation surprises on the upside or geopolitical risks escalate.”


Outlook: Can the Dow Sustain Momentum Above 46,000?

Looking ahead, much will depend on the Federal Reserve’s policy decisions, inflation data, and corporate earnings trajectory. If the Fed signals a rate cut in its upcoming meeting, equities could rally further, potentially pushing the Dow toward fresh highs above 46,500–47,000.

However, if inflation proves sticky or global economic conditions worsen, a pullback toward 45,000 or even 44,500 cannot be ruled out. For now, the market’s technical setup suggests consolidation with a bullish bias. Investors should remain alert, balancing opportunities with prudent risk management.

In conclusion, the Dow Jones Industrial Average remains a barometer of global investor confidence. Its current resilience near 46,000 highlights both the strength of U.S. corporate earnings and the cautious optimism surrounding monetary policy. The next few weeks will be crucial in determining whether this optimism translates into sustained gains or if external risks trigger a deeper correction.


Disclaimer: The information in this article is for educational and informational purposes only. It should not be construed as financial advice. Investors are advised to conduct their own research or consult with a licensed financial advisor before making investment decisions.

Bitcoin Climbs Above $114,500 as Bulls Regain Control Amid Market Recovery

29

Introduction

Bitcoin (BTC/USD) surged past $114,500 on September 11, 2025, marking a strong comeback after weeks of volatility. The world’s largest cryptocurrency gained over 0.45% in a single day, supported by renewed buying pressure, technical recovery signals, and improved market sentiment across digital assets. With resistance levels at $115,185 and $117,205 in sight, traders are eyeing whether Bitcoin can sustain momentum and potentially test the $120,000 mark in the near term. The recent rally suggests growing investor optimism, though challenges remain from regulatory uncertainty and global macroeconomic shifts.


Bitcoin Breaks Key Resistance Zone

Bitcoin’s price action shows that it has successfully moved above the critical 20-day simple moving average (SMA) of $111,362, an important technical milestone after weeks of trading below this level. This move signals renewed bullish momentum and opens the path for further upside potential.


Bitcoin surges above $114,500, breaking resistance near the 20-day SMA.

The Bollinger Bands on the daily chart highlight increasing volatility, with BTC touching the upper band at around $115,185. This suggests strong buying momentum as investors look past short-term uncertainties. Importantly, the psychological support at $107,500 held firm during earlier corrections, providing a base for the current rebound.

Technical analysts emphasize that if Bitcoin can hold above $114,500 and close above $115,000 consistently, it may pave the way for a retest of $117,200 and later the more significant resistance at $120,091. Such a move would represent a substantial bullish shift in market structure, potentially reigniting confidence among institutional investors who had remained cautious in recent months.


Strengthening Momentum Amid Growing Institutional Interest

The latest rally is not merely technical; it reflects deeper fundamental factors supporting Bitcoin’s price. Over the past month, institutional inflows into digital asset funds have increased. Reports suggest that Bitcoin-focused exchange-traded products (ETPs) recorded significant net inflows as investors sought exposure to crypto without directly holding tokens.

Insert Relevant Image Here
Caption: Institutional inflows and renewed retail interest are driving Bitcoin’s September rally.

Large players such as hedge funds and family offices are gradually re-entering the Bitcoin market. According to a recent survey, over 52% of institutional investors believe Bitcoin will outperform traditional assets in the final quarter of 2025. This renewed optimism comes as inflation fears ease and central banks worldwide hint at more accommodative policies, making alternative assets like Bitcoin more attractive.

Retail investors are also returning, buoyed by positive sentiment across the crypto ecosystem. Trading volumes on major exchanges have spiked in early September, reflecting heightened activity. Social media chatter around Bitcoin has surged, with hashtags like #BTCBullRun and #CryptoRevival trending globally.

This momentum highlights Bitcoin’s dual role: as both a risk asset benefiting from broader market optimism and a hedge against long-term macroeconomic uncertainties. Traders are now speculating whether Bitcoin could replicate its historic Q4 rallies, which have often delivered outsized returns.


Regulatory Landscape: A Double-Edged Sword

While technicals and inflows signal strength, Bitcoin’s future path is still heavily influenced by regulatory dynamics. Several countries are advancing clearer frameworks for digital assets, which could encourage mainstream adoption. For instance, the U.S. Securities and Exchange Commission (SEC) recently indicated progress on spot Bitcoin ETF approvals, a long-awaited development that could unlock billions in institutional capital.

At the same time, regulatory risks remain. Some governments continue to express concerns about crypto’s use in illicit finance and its potential impact on financial stability. New tax rules in Europe and compliance pressures in Asia have created short-term uncertainty for global exchanges and investors.

Analysts note that while regulation often sparks volatility, it also legitimizes the industry in the long run. “The key is balance—regulation that protects investors without stifling innovation,” said a blockchain policy expert.

For now, traders remain cautiously optimistic that positive regulatory clarity will outweigh restrictive policies. A breakthrough in ETF approvals or standardized global guidelines could serve as a massive bullish catalyst for Bitcoin, potentially propelling it toward the $125,000 mark.


Market Outlook: Is $120,000 the Next Target?

The central question is whether Bitcoin’s current rally has enough momentum to push past $120,000, a major resistance level. Market watchers are divided.

Optimists argue that Bitcoin’s fundamentals—limited supply, increasing institutional adoption, and macroeconomic tailwinds—make a strong case for continued upside. They point to historical data showing that Bitcoin often experiences strong rallies in the final quarter of the year, particularly when breaking through major resistance zones.

Skeptics, however, warn of potential hurdles. Bitcoin remains highly correlated with global equity markets, which are vulnerable to shocks from geopolitical tensions, oil price volatility, or sudden policy shifts by the U.S. Federal Reserve. A hawkish Fed, for instance, could dampen risk appetite and cap Bitcoin’s gains.

For traders, the $114,000–$115,500 zone is now critical. A decisive break above $115,185 could trigger a rally toward $117,200 and later $120,000. On the downside, failure to hold $111,000 could invite selling pressure and push BTC back toward the $107,500 support.


Conclusion: Balancing Hype with Caution

Bitcoin’s climb above $114,500 signals a renewed wave of optimism in the crypto market. Technical breakouts, rising institutional inflows, and shifting regulatory narratives all contribute to the bullish outlook. However, the road ahead is not without risks, as macroeconomic factors and regulatory decisions could significantly impact short-term price action.

Investors should view the current rally as a positive sign of resilience but remain cautious about volatility. The next few weeks, particularly around the $117,200–$120,000 zone, will be decisive in shaping Bitcoin’s trajectory into the final quarter of 2025. Whether BTC consolidates, corrects, or continues its upward march, one thing is clear: Bitcoin remains at the center of the financial world’s attention.


Disclaimer

This article is for informational purposes only and does not constitute financial advice. Cryptocurrency investments are highly volatile and carry risks. Readers are advised to conduct independent research or consult financial experts before making any investment decisions.

Top 50 Crypto Coins

Dow Jones Surges Past 46,000: Market Signals Strength Amid Economic Uncertainty

9

Introduction

The Dow Jones Industrial Average (DJIA) surged past the 46,000 level on September 11, 2025, gaining more than 579 points in a single session. This sharp rally, marked by strong green candlesticks on technical charts, suggests renewed investor confidence despite lingering concerns over inflation, interest rates, and global trade tensions. Technical indicators, including Bollinger Bands and resistance levels, highlight the potential for further upside, though traders remain cautious about volatility. The move positions the Dow near fresh record highs, igniting discussions about whether this marks the beginning of a sustained bull run.


Strong Breakout Above Resistance Levels

The Dow Jones has managed to break decisively above the critical resistance zone around 45,789, a level it struggled to cross over recent weeks. This technical breakout is significant because it marks the end of a consolidation phase that lasted nearly a month. Analysts suggest that once a major index breaks above such a level with strong volume and momentum, it often signals the possibility of extended gains in the short to medium term.

Dow Jones breaks resistance, surges above 46,000 on September 11, 2025.

The Bollinger Bands displayed in the chart reveal that the index touched the upper band, confirming strong bullish momentum. Typically, when prices ride the upper band, they indicate aggressive buying pressure and sustained optimism in the market. Moreover, the 20-day simple moving average (SMA), shown at 45,343, acted as reliable support during the last pullbacks, providing a springboard for the current rally.

This breakout can be tied to improving investor sentiment regarding the U.S. economy. Strong corporate earnings, coupled with signals from the Federal Reserve that rate cuts could be on the horizon, have combined to inject optimism into equity markets. However, it is essential to note that breakouts must sustain over a few sessions before confirming a long-term uptrend. Should the Dow maintain momentum above 46,000, traders could target the next psychological resistance near 46,500.


Investor Confidence Returns Despite Global Concerns

The broader market context adds weight to this breakout. Investors have recently been grappling with uncertainty over global trade, rising energy prices, and ongoing geopolitical tensions. Despite these factors, U.S. equities have shown resilience, with the Dow outperforming expectations.

Corporate earnings for Q2 have provided a cushion, with several blue-chip companies beating analyst projections. Tech-heavy peers like the NASDAQ have also contributed to positive momentum, reflecting a more risk-on attitude from investors. “What we are witnessing is not just a technical breakout but also a psychological shift in investor confidence,” remarked one market strategist.

For retail investors, the breakout offers opportunities to ride the bullish wave. However, experts caution that chasing highs without proper risk management could expose portfolios to sharp corrections. Volatility often spikes after large one-day gains, and traders are advised to keep an eye on upcoming economic data, including inflation reports and job numbers.

The U.S. Federal Reserve’s upcoming policy stance will play a decisive role. A dovish tilt could further fuel equities, while hawkish commentary might cap gains. Still, the current rally reinforces the notion that Wall Street is optimistic about the economy’s resilience in the face of global headwinds.


Technical Indicators Suggest Momentum May Continue

On the technical side, several indicators align with the bullish narrative. The Bollinger Bands, which track volatility, show a widening pattern, suggesting the potential for stronger price movements. The fact that the Dow closed near the upper band indicates that buying pressure remains robust.

Similarly, the moving average convergence divergence (MACD), though not displayed in the chart, has reportedly been trending upward across market analyses, hinting at continued bullish momentum. Short-term traders see the 45,076 support level as critical—if maintained, it will serve as a base for further gains. On the upside, crossing 46,217 would cement the breakout and potentially open doors toward record highs.

Another important factor is volume. Strong rallies sustained by high trading volumes tend to be more reliable than low-volume breakouts. Market observers noted a significant uptick in trading activity during the September 11 session, reinforcing the strength of this breakout.

Furthermore, historical data shows that September is traditionally a volatile month for U.S. equities. Yet, when markets start the month strong, they often finish on a positive note. If the Dow sustains its gains through mid-September, investors could expect momentum to carry into the final quarter of the year.


Macro Factors Driving the Rally

Beyond technicals, macroeconomic trends are fueling optimism. The U.S. economy continues to show resilience, with GDP growth outperforming expectations. The labor market remains steady, and wage growth has supported consumer spending, the backbone of the American economy.

At the same time, inflation appears to be cooling compared to last year’s peaks, giving the Federal Reserve room to ease its aggressive monetary tightening. Market participants are increasingly betting on a rate cut before the end of 2025, which would reduce borrowing costs and further stimulate corporate investment.

Global markets have also played a role. Europe’s stabilization after energy shocks and China’s incremental recovery have contributed to a more balanced outlook for international trade. These factors, combined with a softer dollar, have strengthened the case for U.S. equities.

Investor sentiment surveys highlight a growing bullish bias. A recent poll suggested that over 60% of institutional investors expect U.S. equities to outperform bonds in the coming months. This shift in allocation is likely to support sustained inflows into indices like the Dow.


Market Outlook: Is 47,000 Within Reach?

The critical question now is whether the Dow Jones can sustain its rally and march toward 47,000 or even higher levels. Analysts remain divided. Optimists argue that the combination of strong technicals, resilient earnings, and easing macroeconomic risks makes a compelling case for further upside. Pessimists, however, warn that valuations are becoming stretched, and any negative surprise—be it from inflation, Fed policy, or geopolitical events—could trigger a pullback.

Short-term traders will closely monitor the 46,000–46,200 zone, as failure to sustain above this range could lead to consolidation or minor corrections. However, if momentum continues, the next resistance zone near 46,500–46,700 could be tested within weeks.

For long-term investors, the message is clearer: staying invested in fundamentally strong companies within the index remains a prudent strategy. “Timing the market is difficult, but time in the market has consistently rewarded patient investors,” noted a senior wealth advisor.

Looking ahead, the Dow’s trajectory will depend heavily on upcoming macroeconomic data and central bank signals. The next Federal Reserve meeting, scheduled later this month, will be closely watched for hints about monetary easing. Meanwhile, corporate earnings reports in October will provide additional clarity on whether companies can maintain profit growth in a challenging global environment.


Conclusion: Balancing Optimism with Caution

The Dow Jones’ breakout above 46,000 is a major technical and psychological milestone for global markets. It signals growing confidence in the resilience of the U.S. economy and sets the stage for potential new highs in the coming months. Technical indicators support the bullish narrative, and macroeconomic fundamentals provide a favorable backdrop.

Yet, markets rarely move in a straight line. Investors must balance optimism with caution, staying alert to risks such as geopolitical instability, inflationary pressures, and sudden policy shifts. For now, the Dow’s breakout offers a strong signal of renewed market strength, but sustaining momentum will require continued economic resilience and investor confidence.


Disclaimer

This article is intended for informational purposes only and should not be considered financial advice. Investors are encouraged to conduct their own research or consult with financial professionals before making investment decisions.

Top 50 Crypto Coins

Dow Jones Today: Market Sentiment Balances Between Bulls and Bears as Key Levels Hold

10

Introduction

The Dow Jones Industrial Average (DJI) is at a crucial turning point. After weeks of volatility, the index has managed to reclaim important support near the 45,000 mark. Technical patterns on the daily chart highlight consolidation, with traders watching closely for either a breakout toward new highs or a possible retest of lower levels. As global macroeconomic uncertainty, inflation data, and Federal Reserve policy continue to weigh heavily on sentiment, the Dow’s next move could set the tone for broader U.S. equity markets.


Key Technical Levels Define Market Direction

The Dow Jones Industrial Average has spent the past month oscillating between strong resistance near 45,600 and support around 45,000. This range-bound movement reflects investor caution in the face of mixed economic data. On the chart, Bollinger Bands indicate contraction, a sign that volatility may soon expand, while the 20-day moving average sits around 44,992, providing dynamic support.

The bounce from recent lows suggests that buyers are active, but sellers continue to defend the higher range, creating a tug-of-war scenario. A sustained close above 45,600 could trigger momentum-driven buying, while a break below 44,900 might invite stronger bearish pressure. Market analysts agree that this consolidation phase is critical: it often precedes significant directional moves, especially in a market that has already seen sharp rallies and corrections in 2025.

“Dow Jones Industrial Average daily chart highlighting support and resistance zones.”


The Role of Investor Psychology and Market Sentiment

Investor psychology remains a dominant factor in shaping the Dow’s trajectory. Market participants are split between optimism over potential interest rate cuts and fears of persistent inflationary pressures. This duality is reflected in daily trading volumes: strong buying days are often followed by equally forceful selling sessions.

Historical patterns show that when the Dow forms prolonged consolidation channels, breakout moves are often swift and decisive. For instance, during 2019 and 2021, similar patterns preceded rallies of over 1,000 points within weeks. Traders are therefore preparing for both scenarios, setting stop-losses tightly and hedging their portfolios with options.

Financial strategist Michael Hartnett commented, “The 45,000 level is not just a technical floor; it represents investor confidence in U.S. resilience. If that cracks, it will signal more than just a chart breakdown—it will reflect a deeper shift in market psychology.”


Global Economic Cues Drive Uncertainty

Beyond technical indicators, global macroeconomic conditions are playing a significant role in shaping the Dow’s movement. Inflation reports from the U.S. continue to influence the Federal Reserve’s stance on rate adjustments. Recent commentary from Fed officials hinted at patience, suggesting that while rate cuts are possible later this year, policymakers remain cautious until data confirms a steady cooling of inflation.

Internationally, slowing growth in Europe and concerns about China’s real estate sector have added uncertainty. The U.S. stock market, despite being a relative safe haven, is not immune to global spillover effects. Investors are increasingly factoring in supply chain risks, geopolitical tensions, and fluctuating commodity prices when assessing the outlook for blue-chip stocks that make up the Dow.

A broader look reveals that sectors such as technology and industrials are showing resilience, while financials and consumer discretionary stocks lag. This divergence highlights the uneven impact of macroeconomic trends, making stock-picking strategies more relevant than index-wide bets.


Corporate Earnings and Sector Rotation

Corporate earnings remain another key driver for the Dow. With second-quarter earnings season recently concluded, results were mixed. While companies like Microsoft and Caterpillar outperformed expectations, others in the consumer and financial sectors disappointed.

Sector rotation is evident: investors are favoring stable dividend-paying stocks and defensive sectors like healthcare, while reducing exposure to cyclical names. This rotation explains why the Dow has been more resilient compared to the tech-heavy Nasdaq, which is more sensitive to interest rate expectations.

Investment manager Sarah Logan noted, “Earnings are the ultimate truth-teller in markets. Right now, Dow components with strong balance sheets and consistent cash flows are being rewarded, while weaker names are punished disproportionately.”


Outlook: Will the Dow Break Out or Break Down?

Looking ahead, the Dow faces a pivotal few weeks. Traders will be watching upcoming U.S. inflation data, the Fed’s next policy meeting, and global growth signals for cues. Technical setups suggest a breakout is imminent—either upward beyond 45,600, signaling fresh bullish momentum, or downward below 44,900, confirming bearish control.

If the index breaks higher, analysts expect the next target around 46,200, a level not seen since early summer. Conversely, a breakdown could drag the index toward 44,200, which aligns with the lower Bollinger Band and prior support zones.

In either case, the Dow’s performance will be a bellwether for U.S. equity sentiment at large. With the S&P 500 and Nasdaq also trading near critical levels, investors must brace for heightened volatility.


Conclusion

The Dow Jones Industrial Average stands at a crossroads, reflecting both technical consolidation and macroeconomic uncertainty. With global cues, Federal Reserve policy, and investor sentiment all playing influential roles, the index’s next big move could reshape equity market expectations for the remainder of 2025. Traders and investors alike must stay vigilant, balancing risk and opportunity as the battle between bulls and bears intensifies.


Disclaimer

This article is for informational purposes only and should not be considered financial advice. Investors should conduct their own research or consult a licensed financial advisor before making investment decisions.

Top 50 Crypto Coins

Bitcoin Price Slips Below $110K: Key Support Levels Tested as Market Awaits Reversal

10

Introduction

Bitcoin (BTC) has entered a critical phase after slipping below the $110,000 mark, testing strong support levels near $107,000. The recent decline has been driven by rising selling pressure, weak momentum, and investor caution ahead of key economic updates. Traders are closely monitoring the charts, where technical indicators suggest oversold conditions may spark a relief rally, yet the overall trend remains bearish unless BTC reclaims the $120,000 zone. This article explores Bitcoin’s short-term and medium-term price outlook, crucial support and resistance levels, and what investors should watch in the coming weeks.


Bitcoin Tests Critical Support Near $107,000

The most significant development in Bitcoin’s recent performance is its struggle around the $107,200 support zone. This area has emerged as a decisive battleground between buyers and sellers. On the daily chart, BTC touched the lower Bollinger Band, a sign that the asset has entered an oversold territory. Historically, such dips often attract short-term buyers looking for bargain entries.

Trading volume has spiked during this correction, indicating strong market participation. However, most of this activity is tilted toward selling, reflecting fear among investors. The 20-day Simple Moving Average (SMA), currently at $114,876, has acted as a strong resistance, keeping upward momentum capped. Unless BTC reclaims this moving average, the bearish outlook is likely to dominate in the near term.

“Bitcoin daily chart showing support near $107,200 and resistance around $120,000.”


Bearish Pressure Dominates but Relief Rally Possible

The broader market structure suggests caution. Bitcoin has been in a downtrend since mid-August, shedding gains after failing to sustain above $120,000. The breakdown below $110,000 intensified bearish momentum, with analysts now eyeing the $104,000–$105,000 range as the next potential support if the $107,000 level fails.

On the other hand, the oversold nature of the asset leaves room for a relief rally. Short-term traders may find opportunities if BTC manages to bounce toward $112,000–$115,000, where selling pressure could once again build up. According to multiple market observers, such rebounds should not be mistaken for trend reversals unless Bitcoin breaks and sustains above the $118,300–$120,000 resistance zone.

This view is supported by the Bollinger Bands indicator. While the price has touched the lower band, the middle band (20 SMA) continues to slope downward, reflecting prevailing bearish sentiment. If the price recovers above this level, it could open the doors to a stronger recovery. Until then, rallies are likely to be capped.


Investor Sentiment: Fear and Caution Prevail

Market psychology plays a vital role in shaping Bitcoin’s trajectory. At present, investor sentiment is dominated by caution. The recent sell-off has triggered heightened concerns about macroeconomic factors, such as the potential for further interest rate adjustments by the U.S. Federal Reserve and shifting liquidity in global markets.

Institutional investors, who were actively accumulating Bitcoin during its surge toward $125,000, appear to be on the sidelines for now. Trading desks report that retail traders are mostly cautious, with many waiting for confirmation signals before re-entering the market.

Some experts note that psychological levels such as $100,000 could also influence decision-making. If BTC approaches this round number, panic selling may increase, while long-term investors may view it as an attractive buying opportunity. For now, the market is in a wait-and-watch mode, with traders carefully evaluating short-term setups while keeping an eye on macroeconomic headlines.


Medium-Term Outlook: What to Watch in the Coming Weeks

While the short-term picture remains dominated by volatility and selling pressure, the medium-term outlook depends heavily on Bitcoin’s ability to reclaim lost ground. A daily close above $118,300 would mark the first sign of strength and could pave the way toward $120,091 and eventually $122,555–$125,006. These levels represent strong resistance zones, where sellers are likely to defend aggressively.

If Bitcoin fails to hold above $107,000, the focus will shift to lower supports. A breakdown below this level could open the path to $104,000 and potentially $101,000. Analysts warn that such a move could trigger broader market corrections in altcoins, as BTC’s dominance remains high.

Technical traders are also watching for divergences in momentum indicators such as the Relative Strength Index (RSI). Any bullish divergence could hint at an early reversal, while continued weakness would reinforce the bearish case. In either scenario, the coming weeks are likely to be decisive for Bitcoin’s medium-term direction.


Final Thoughts: Bitcoin at a Crossroads

Bitcoin’s recent dip below $110,000 has brought the cryptocurrency to a crossroads. On one hand, oversold conditions and strong support near $107,200 offer hope for a short-term rebound. On the other hand, sustained selling pressure and macroeconomic uncertainties keep the broader outlook bearish.

For traders, the strategy is clear: monitor the $107,000 support zone and the $118,300–$120,000 resistance zone closely. A break in either direction will likely set the tone for September’s trading. Long-term investors may view the ongoing correction as a natural phase in Bitcoin’s cycle, while short-term players need to remain vigilant and disciplined with stop-loss placements.

As always, volatility remains Bitcoin’s trademark, and the coming sessions could deliver sharp swings in either direction. Market participants should stay updated with technical signals and global financial developments, as these factors will heavily influence the next major move in BTC.


Disclaimer

This article is for informational purposes only and should not be considered financial advice. Cryptocurrency investments are highly volatile and involve significant risks. Readers should conduct their own research or consult a financial advisor before making investment decisions.

Top 50 Crypto Coins

Wall Street Cautious as Nvidia Earnings Loom: Tech Valuations, AI Euphoria, and Market Volatility in Spotlight

14

Introduction
U.S. equities treaded cautiously on Wednesday, with Wall Street split between optimism and unease ahead of Nvidia’s much-anticipated quarterly results. The Dow Jones Industrial Average (DJIA) showed sharp intraday swings—sliding earlier before staging a late rebound, reflecting investor nervousness as Nvidia’s earnings are seen as a make-or-break moment for the broader AI-driven rally.


Dow Jones Volatility Mirrors Investor Sentiment

The 15-minute Dow Jones chart highlights this tension clearly: the index fell through much of Tuesday’s session but recovered sharply just before market close. The spike in buying momentum pushed prices toward the upper Bollinger Band, signaling heightened volatility and short-term bullish bets. Yet, trading volumes suggest that institutional investors are waiting for Nvidia’s earnings before committing to broader market moves.


Nvidia at the Center of AI Mania

Nvidia, now the world’s largest publicly traded company with a valuation north of $4 trillion, has become the heartbeat of the AI trade. Analysts expect revenue to soar more than 50% year-over-year to nearly $46 billion, with gross margins around 72%.

But the stakes go beyond raw numbers. Nvidia’s results will serve as a litmus test for whether the AI megacap rally—responsible for nearly half of the S&P 500’s year-to-date gains—still has fuel, or whether investors have priced in too much optimism too quickly.


Options Market Signals Historic Swing

Derivatives traders are bracing for a $260 billion swing in Nvidia’s market value, with implied volatility suggesting a potential 6% move in either direction. While that’s slightly below Nvidia’s historical earnings-day volatility, the sheer size of the company makes it one of the most consequential events in global markets this quarter.

If Nvidia delivers strong results and upbeat guidance, the ripple effect could lift not just chipmakers but the broader tech complex. A disappointment, however, could trigger a correction across AI-related equities, dragging down major indices like the S&P 500 and Nasdaq.


Macro & Political Backdrop Complicates the Picture

Beyond Nvidia, markets are wrestling with a complex macro environment. Former President Trump’s attempt to oust a Federal Reserve governor has raised alarms over central bank independence, adding political risk at a sensitive time. Meanwhile, bond markets are increasingly pricing in a September Fed rate cut, with short-dated yields easing.

On the geopolitical front, Nvidia’s reliance on China is under scrutiny. U.S. export restrictions and Beijing’s pushback against licensing agreements have made investors wary about the sustainability of Nvidia’s overseas growth. Any commentary in Nvidia’s earnings on China sales could significantly sway market sentiment.


Tech Valuations in the Crosshairs

Wall Street strategists remain divided. Bulls argue that AI is a genuine technological revolution that justifies Nvidia’s premium valuation, currently trading at a forward P/E of ~33–34. Skeptics, however, point to warnings from OpenAI’s Sam Altman and recent MIT studies, which suggest AI adoption is still far from generating the productivity boom expected by investors.

This valuation debate is what makes Nvidia’s results pivotal—strong numbers could extend the AI rally, while any stumble could amplify fears of a speculative bubble.


The Bigger Picture: What’s Next for Wall Street?

  • Upside scenario: Nvidia beats expectations, reassures on China demand, and provides strong guidance → Tech rally reignites, pushing Nasdaq and S&P 500 to fresh highs.
  • Downside scenario: Results miss or guidance disappoints → AI trade cools, volatility spikes, and indices correct.
  • Neutral scenario: Nvidia meets expectations without surprises → Markets consolidate, but volatility persists as investors rotate into undervalued sectors.

Conclusion
Wall Street is essentially holding its breath. The Dow’s intraday rebound reflects a market torn between optimism and caution. Nvidia’s earnings will not just decide the near-term fate of one stock—they may define whether the AI boom remains a durable growth story or slips into bubble territory.

Top 50 Crypto Coins

Bitcoin Faces Resistance at $117K as Bulls Struggle to Sustain Momentum

13

Introduction

Bitcoin’s price action has entered a critical phase as the flagship cryptocurrency continues to battle resistance levels around $117,000. After a sharp recovery from the $112,000 support zone, BTC is now encountering selling pressure near its 20-day simple moving average (SMA) and upper Bollinger Bands. Market sentiment remains mixed, with traders closely watching whether Bitcoin can reclaim the $120,000 psychological level or slip further toward lower support zones. The coming days could determine the short-term trajectory of the crypto market as investors balance optimism with caution.


Bitcoin Price Analysis: Resistance Levels in Focus

After showing resilience near the $112,000 support, Bitcoin rebounded sharply, triggering hopes of a bullish reversal. However, the rally faced stiff rejection just above $117,000, coinciding with the 20-day SMA (around $116,742). The price currently trades near $114,900, reflecting a decline of nearly 1.70% in the past 24 hours.

Bitcoin daily candlestick chart shows resistance around $117K and support near $112K.

Bitcoin’s inability to break above $117,000 highlights the strength of selling pressure from bears. On the upside, immediate resistance lies between $117,000 and $120,000, where multiple technical indicators converge. Above $120,091, a breakout could open the path toward $122,000 and eventually the $125,000 psychological level. Conversely, strong support is found around $111,718, which aligns with the lower Bollinger Band. A breakdown below this zone could trigger further declines toward $110,000.

Market experts point out that the recent price swings are influenced by macroeconomic conditions, particularly U.S. Federal Reserve policy expectations. Traders anticipate potential rate cuts, which could act as a catalyst for Bitcoin’s next move. For now, BTC is consolidating, with bulls needing to defend critical support to maintain upward momentum.


Trading Volume and Market Sentiment: Bulls vs. Bears

Trading volumes provide key insights into current sentiment. According to the chart, Bitcoin’s daily volume has remained modest, with neither side showing dominance. This suggests indecision among traders. The green candles on August 20–21 showed strong buying momentum, but the follow-up red candle indicates that bears remain active around resistance levels.

Institutional investors have also shown caution. While exchange-traded funds (ETFs) continue to attract inflows, many large funds are waiting for confirmation of a breakout above the $120,000 barrier before committing to significant allocations. Retail traders, meanwhile, remain optimistic, expecting the halving cycle and growing global adoption to fuel long-term gains.

Historically, Bitcoin thrives on periods of consolidation before making decisive moves. For example, similar patterns were observed in late 2020 before BTC surged past $20,000 and entered its historic bull run. Analysts suggest that a clear close above $120,000 could trigger renewed buying interest, while failure to hold above $112,000 might extend the correction phase.


Macro Factors Influencing Bitcoin’s Movement

Several external factors are shaping Bitcoin’s near-term price action. First, the broader financial market is reacting to Jerome Powell’s comments on monetary policy. Any indication of interest rate cuts tends to favor risk assets like Bitcoin. Conversely, a hawkish stance can pressure prices.

Second, global economic uncertainty, including inflation concerns and geopolitical tensions, is driving demand for decentralized assets. Many investors view Bitcoin as “digital gold” — a hedge against fiat currency devaluation. This narrative has grown stronger as central banks expand monetary easing.

Third, regulatory developments remain a double-edged sword. In the U.S., the Securities and Exchange Commission (SEC) continues to scrutinize crypto projects, while simultaneously approving Bitcoin ETFs. Such moves create both optimism and fear among investors. In Asia, rising adoption in countries like Japan and South Korea is contributing to positive sentiment.

Despite these mixed signals, Bitcoin’s fundamentals remain robust. Network activity, mining difficulty, and hash rate continue to rise, indicating strong blockchain health. These metrics support the long-term bullish case for BTC, even if short-term corrections persist.


Future Outlook: Can Bitcoin Break $120K?

Looking ahead, Bitcoin’s performance largely depends on whether bulls can reclaim the $120,000 zone. Technical indicators suggest that the next major move is imminent. The Bollinger Bands are widening, signaling increased volatility. A sustained close above the 20-day SMA could attract further buying, while rejection may push BTC back toward the $112,000–$110,000 support range.

If Bitcoin manages to break $120,091 convincingly, the rally could extend to $122,000 and then to the $125,000 resistance, where sellers are expected to re-emerge. On the downside, failure to hold above $111,718 may encourage bears to test deeper levels. However, long-term investors continue to accumulate on dips, signaling confidence in Bitcoin’s future.

Market strategists believe that institutional adoption, ETF inflows, and halving-driven scarcity will eventually push Bitcoin higher. Whether that happens in the coming weeks or months depends on macroeconomic triggers and investor sentiment. For now, the crypto market waits for clarity as BTC hovers near critical resistance.


Conclusion: A Pivotal Moment for Bitcoin

Bitcoin is at a crossroads, trading between strong resistance and solid support. With macroeconomic factors, technical patterns, and investor psychology all playing crucial roles, the coming weeks could set the stage for the next big move. Whether BTC breaks above $120,000 or falls back to retest $112,000, one thing remains clear: volatility will continue to define Bitcoin’s journey.

Investors should remain cautious, closely tracking key levels and global market developments. For traders, the $117K–$120K range is a make-or-break zone, while long-term holders may see any correction as an opportunity to accumulate. As Bitcoin matures as an asset class, each price swing offers both risk and opportunity, making it one of the most closely watched instruments in the world of finance.


Disclaimer

This article is for informational purposes only and does not constitute financial advice. Cryptocurrency investments carry risks, and readers are advised to conduct their own research or consult with a financial advisor before making investment decisions.

Top 50 Crypto Coins