

The Nifty 50 index, a benchmark for Indian equity markets, closed at ₹25,082.30 on July 14, 2025, reflecting a daily decline of 67.55 points or -0.27%. Amid growing global uncertainty, heavy institutional selling, and technical weakness, the index has now slipped below its 20-day Simple Moving Average (SMA), raising red flags for short-term investors and traders.
In this detailed article, we will analyze the latest Nifty 50 chart using key indicators such as Bollinger Bands, volume analysis, support and resistance levels, and candlestick patterns. We’ll also provide insights into what this means for the markets in the coming days, and key trading levels to watch.
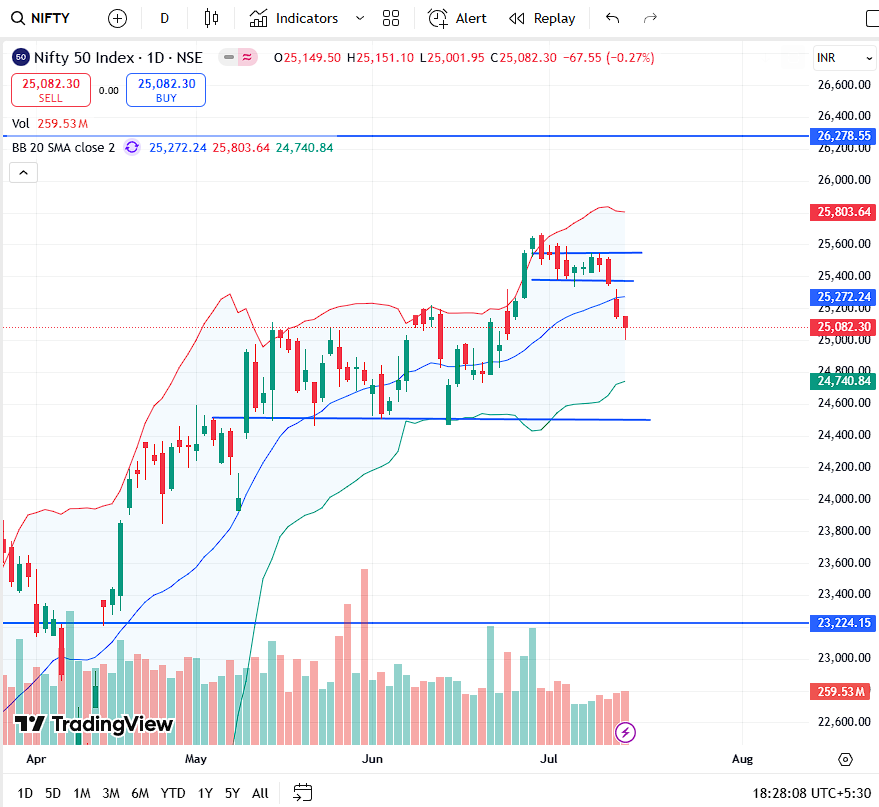
Overview of Market Performance on July 14, 2025:
- Open: ₹25,149.50
- High: ₹25,151.10
- Low: ₹25,001.95
- Close: ₹25,082.30
- Volume: 259.53 million
- Daily Change: -67.55 points (-0.27%)
The day began with a flat opening but selling pressure intensified during the second half, dragging the index to close near the day’s low.
Technical Indicators & Chart Patterns:
1. Bollinger Bands – Early Warning of Volatility
The Bollinger Bands on the daily chart (20 SMA, close 2) suggest increased volatility:
- Upper Band: ₹25,803.64
- Middle Band (20 SMA): ₹25,272.24
- Lower Band: ₹24,740.84
The index has now decisively broken below the middle band (20 SMA), indicating a shift from bullish to bearish momentum in the short term. A move toward the lower Bollinger Band at ₹24,740 is likely in the next few sessions unless bulls regain control quickly.
2. Support & Resistance Levels – Key to Watch
🔵 Immediate Resistance Zones:
- ₹25,272 – Recent 20-SMA zone
- ₹25,400 – Previous consolidation high
- ₹25,803 – Recent swing high (upper band resistance)
🟢 Immediate Support Zones:
- ₹25,000 – Psychological level (now breached intraday)
- ₹24,740 – Lower Bollinger Band
- ₹24,400 – Key swing low support from June
🔵 Major Support:
- ₹23,224.15 – Long-term breakout support and crucial demand zone
If ₹24,740 fails to hold, Nifty could revisit the ₹24,400–23,800 zone in a correction mode.
3. Volume Analysis – Institutional Selling Pressure
The volume for the session was 259.53M, higher than the average of the previous few sessions. Rising red (bearish) volume bars over the last few days confirm increased institutional selling or profit booking.
This kind of volume spike on a down day typically signals stronger conviction by bears, increasing the probability of a short-term correction.
4. Bearish Candlestick Structure & Breakdown Pattern
The recent candlestick structure on the daily chart is forming a descending setup after failing to sustain above ₹25,800. The pattern is beginning to resemble a double top formation, where two peaks form near the same resistance level (₹25,800), followed by a decline below the neckline (₹25,272).
A double top is a bearish reversal pattern, and a breakdown below ₹24,740 would confirm the pattern, triggering deeper downside targets of ₹24,400 and ₹23,800.
What’s Weighing on the Index?
1. Global Headwinds:
- Continued volatility in US markets
- Weak macroeconomic data from China and Europe
- Concerns over US interest rate direction
2. Domestic Factors:
- Mixed earnings results
- Weak monsoon in some states impacting sentiment
- FII outflows amid global reallocation
What Should Traders Do Now?
🔻 For Short-Term Bears:
- Fresh short entries can be considered below ₹25,000 with a target of ₹24,740, followed by ₹24,400.
- Stop-loss can be placed above ₹25,272.
For Cautious Bulls:
- Wait for a strong bounce back above ₹25,400 before entering fresh longs.
- Consider hedging existing long positions using options.
For Option Traders:
- Bear Put Spread or ATM Straddle with bearish bias may work well in this falling volatility phase.
- Keep a watch on VIX; any sharp spike could accelerate the downside move.
Key Levels for the Coming Week:
| Direction | Level | Comment |
|---|---|---|
| 📈 Resistance 1 | ₹25,272 | 20 SMA and breakdown zone |
| 📈 Resistance 2 | ₹25,400 | Minor swing high |
| 📉 Support 1 | ₹24,740 | Lower Bollinger Band |
| 📉 Support 2 | ₹24,400 | Previous consolidation low |
| 🧨 Breakdown Level | ₹23,224 | Long-term support zone |
Summary & Outlook:
The Nifty 50 is showing clear signs of short-term weakness after a steady rally over the past two months. The breach of the 20-day SMA and bearish candlestick patterns suggest a pullback phase has begun. A retest of ₹24,740 or even deeper levels cannot be ruled out unless strong buying emerges quickly.
In conclusion, traders are advised to stay cautious, avoid aggressive long positions unless Nifty reclaims the 25,400 level, and watch for signs of reversal or breakdown. Volatility is expected to remain elevated in the coming sessions.
Disclaimer:
The information provided in this article is for educational and informational purposes only and should not be considered as financial or investment advice. Stock market investments are subject to market risks. Readers are advised to consult with a certified financial advisor before making any investment decisions. The author and the website are not responsible for any losses incurred based on the information provided in this analysis.


Slotsph8, nice selection of slots! I found a few I really like. Could use a few more table games, but overall a good experience. Ready to spin? Check it out at slotsph8!
Thanks for sharing. I read many of your blog posts, cool, your blog is very good.
For all you football fanatics, bet69 kèo bóng đá is the place to be! They’ve got all the latest odds and info on every game you could want! Game on! bet69 kèo bóng đá
**mitolyn reviews**
Mitolyn is a carefully developed, plant-based formula created to help support metabolic efficiency and encourage healthy, lasting weight management.
Can you be more specific about the content of your article? After reading it, I still have some doubts. Hope you can help me.