

Introduction
The Dow Jones Industrial Average (DJIA) is facing a critical consolidation phase after a sharp rally to recent highs. The index, which touched 44,750 in early July, has started showing signs of weakness as profit-booking and uncertainty in global markets weigh on sentiment. With key support around 43,750 and resistance near 44,550, traders are carefully watching for a breakout or breakdown to determine the next directional move. The upcoming economic data releases and earnings season could act as major catalysts for Wall Street in the coming days.
Technical Overview: Daily Chart Signals a Pullback within a Larger Uptrend
On the daily timeframe, the DJIA closed at 44,088.27, down 0.15%, forming a second consecutive bearish candle after failing to sustain above the 44,500 resistance zone. The index is now trading near the middle Bollinger Band, which is acting as an immediate support area.
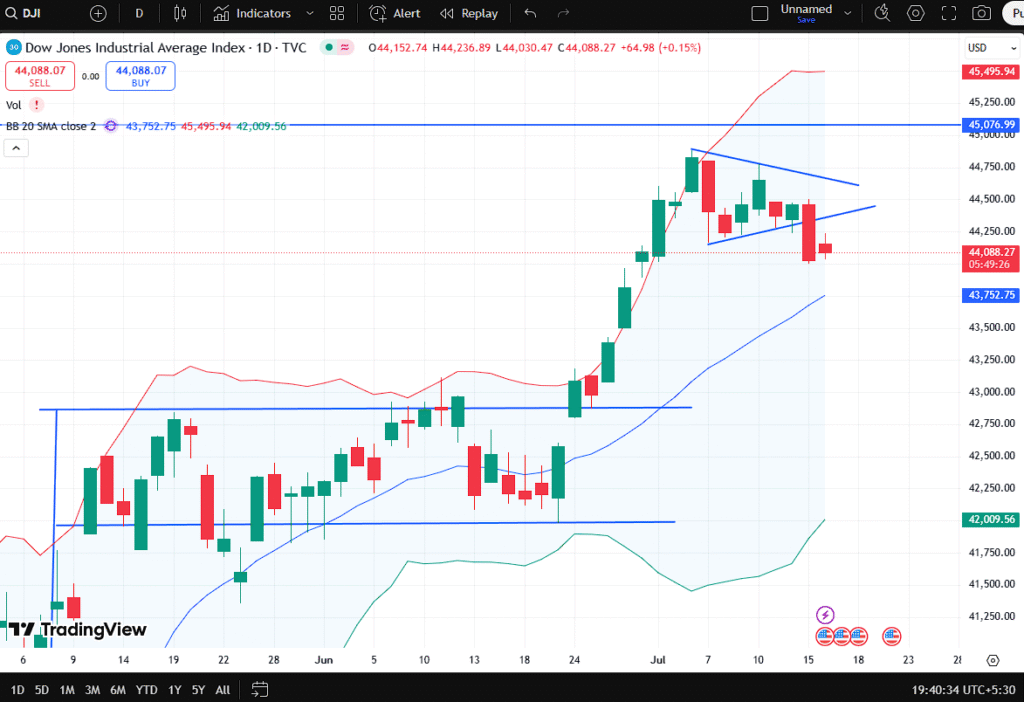
Dow Jones daily chart highlights a pullback after recent highs with crucial support levels in focus.
The Bollinger Bands indicate a volatility squeeze after a strong expansion phase in late June, hinting that the market may enter a range-bound phase before the next big move. The 20-day SMA is currently placed near 43,752, providing strong support.
A falling wedge pattern seems to be forming, which often signals a potential bullish reversal if the index can break above the upper trendline near 44,550. However, failure to hold above 44,000 could open the door for a deeper correction toward 43,500 or even 43,000, which is the previous breakout zone.
Volume has been gradually decreasing during this pullback, suggesting it might be a healthy correction rather than a trend reversal. But traders remain cautious as the RSI on the daily chart has moved from overbought territory above 70 to a more neutral zone around 55, indicating a loss of momentum.
Key Levels to Watch on the Daily Chart
- Immediate Resistance: 44,550 – 44,750 (upper wedge & recent highs)
- Immediate Support: 43,750 – 43,500 (20-SMA & breakout zone)
- Major Support: 43,000 (previous consolidation area)
- Upside Target if Breakout Holds: 45,077 – 45,500
Market sentiment remains mixed, with traders awaiting US retail sales data and bank earnings this week, which could provide fresh directional cues.
Hourly Chart: Narrow Range Trading Suggests Indecision
Looking at the hourly chart, the DJIA shows a clear sideways movement between 44,000 and 44,400 after a sharp intraday selloff. The index is respecting an ascending support line, but at the same time, it is unable to break above the downward-sloping resistance trendline connecting recent highs.
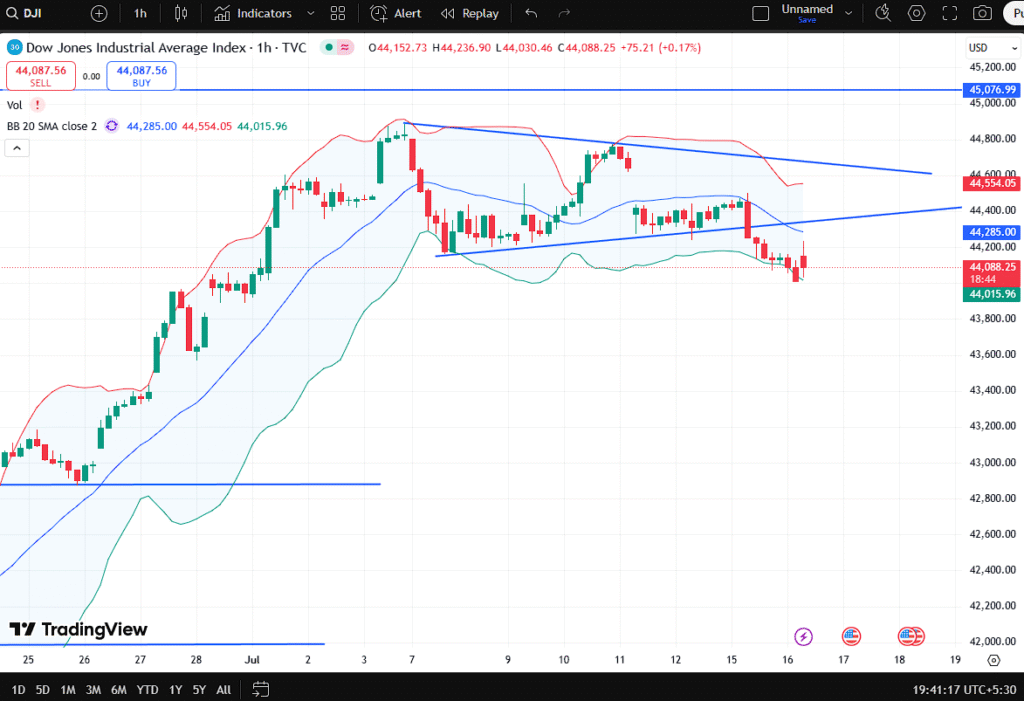
Dow Jones hourly chart shows a narrowing triangle pattern indicating possible breakout direction in upcoming sessions.
The Bollinger Bands on the hourly chart are contracting, signaling low volatility and a likely breakout soon. The 20-hour SMA around 44,285 is acting as immediate resistance. If the index sustains above this level, it could quickly test 44,500, whereas failure to hold above 44,000 could trigger another wave of selling.
Intraday volumes have remained moderate, with no major spikes, reflecting a wait-and-watch mode among short-term traders. The hourly RSI is hovering around 45, suggesting mild bearishness but no extreme selling pressure.
Near-Term Scenarios for Traders
Based on current patterns:
- Bullish Scenario: If DJIA breaks above 44,300–44,400 with volume confirmation, it could attempt another test of 44,550–44,750.
- Bearish Scenario: A close below 44,000 may drag the index toward 43,750–43,500, where the next major support lies.
- Neutral Scenario: Consolidation between 44,000–44,400 continues until new catalysts emerge.
For intraday traders, it is crucial to monitor price action near the triangle breakout zone, as a sharp move in either direction is expected within the next few sessions.
Broader Market Context: Earnings, Inflation, and Fed Outlook
The recent softness in the Dow Jones comes amid a mixed global macroeconomic backdrop. Investors are digesting:
- Upcoming US inflation data, which could influence Federal Reserve’s stance on interest rates.
- Corporate earnings season, starting with major banks and tech companies.
- Geopolitical tensions and oil price fluctuations, adding an extra layer of caution.
Despite the pullback, broader market sentiment remains resilient as S&P 500 and Nasdaq have also entered minor consolidation after record highs. However, analysts warn that a lack of fresh positive triggers could lead to a deeper correction before the next leg higher.
According to some Wall Street strategists, the Dow’s recent rally was driven by defensive buying, and unless there is broad-based sectoral participation, it may struggle to sustain above 45,000.
Future Outlook: Range-Bound Trading Before the Next Major Move?
Looking ahead, the Dow Jones Industrial Average seems poised for a range-bound phase between 43,750 and 44,750 in the near term. While the broader uptrend remains intact, the current pullback signals a healthy pause for the market to cool off from overbought levels.
Key triggers for the next directional move will likely come from:
- Inflation Data: Any surprise in CPI/PPI could sway the Fed’s policy outlook.
- Earnings Results: Strong Q2 earnings could revive bullish momentum, while disappointing numbers may accelerate selling.
- Global Cues: Moves in crude oil, Treasury yields, and geopolitical headlines could impact investor risk appetite.
In conclusion, the Dow Jones is not showing a major trend reversal yet, but traders should be prepared for volatility spikes around key data events. A breakout above 44,750 would confirm bullish continuation toward 45,500, whereas a breakdown below 43,750 would indicate a deeper pullback.
Disclaimer
This analysis is for informational purposes only and should not be considered as financial advice. Investors should consult their financial advisors and consider their risk tolerance before making any trading or investment decisions.


Fala, pessoal! Descobri o 001winbr1 e tô curtindo a variedade de jogos. Ainda tô explorando, mas parece ser uma boa opção pra quem busca diversão. Deem uma olhada! (Hey everyone! I discovered 001winbr1 and I’m enjoying the variety of games. I’m still exploring, but it seems like a good option for those seeking fun. Take a look!)
Your article helped me a lot, is there any more related content? Thanks!
Heard some good things about Taib29 so I decided to give it a whirl. Not disappointed! Good selection of games and the site loads fast. Definitely worth checking out taib29
Downloaded the gugobetapp. The installation process was straight forward. If you’re keen, check it out: gugobetapp. Remember to pace yourself!
I have to say, q5bet is pretty solid. I like the user interface, and the overall experience is pretty smooth. Not too much clutter or fancy stuff, just straightforward gaming, give it a try at q5bet
Heard good things about lucky888pkr, giving it a shot! Hope the games are as smooth as they say. Let’s see if Lady Luck is on my side today. Fingers crossed for some winning combos! Check it out here lucky888pkr
Your point of view caught my eye and was very interesting. Thanks. I have a question for you.
Your point of view caught my eye and was very interesting. Thanks. I have a question for you. https://accounts.binance.info/en/register?ref=JHQQKNKN