
Introduction
The Dow Jones Industrial Average (DJIA) remains one of the most closely watched stock indices in the world, acting as a pulse-check on U.S. market sentiment. On August 18, 2025, the Dow showed mixed signals, with intraday candles hinting at possible short-term weakness but maintaining a broader upward structure. Traders are now asking: Is this just a temporary pullback or the start of a bigger correction?
In this article, we’ll explore the background of recent Dow trends, analyze the latest intraday developments, dive deep into technical indicators such as Bollinger Bands, moving averages, and resistance levels, and provide expert insights and possible scenarios for the coming sessions.
Why the Dow Jones Is at a Critical Turning Point
Over the last few months, the Dow Jones has been navigating through a volatile environment shaped by interest rate expectations, corporate earnings, and geopolitical risks. Historically, August tends to bring higher volatility due to lower summer trading volumes and rebalancing activity by large funds.
In 2023–2024, the Dow demonstrated resilience by recovering from banking-sector stress and inflation-driven sell-offs. Entering mid-2025, the index has remained on an upward trajectory, but intraday swings highlight how sensitive markets are to both macro data and technical resistance zones.
The current chart shows price action consolidating near 45,000 points, a psychologically important level. Historically, such round numbers often act as both resistance and support, attracting heavy institutional activity. Whether the Dow breaks out above 45,100 or slips below 44,700 could define its short-term direction.
Data & Statistics
- Current Price (Aug 18, 2025): 44,875.99
- Intraday High: 44,477.32
- Intraday Low: 44,333.30
- Resistance Levels: 45,080 – 45,100 zone
- Support Levels: 44,406 (20-SMA), 44,699 (Bollinger Band midline)
- Volatility: Bollinger Bands widening slightly, signaling increased short-term swings
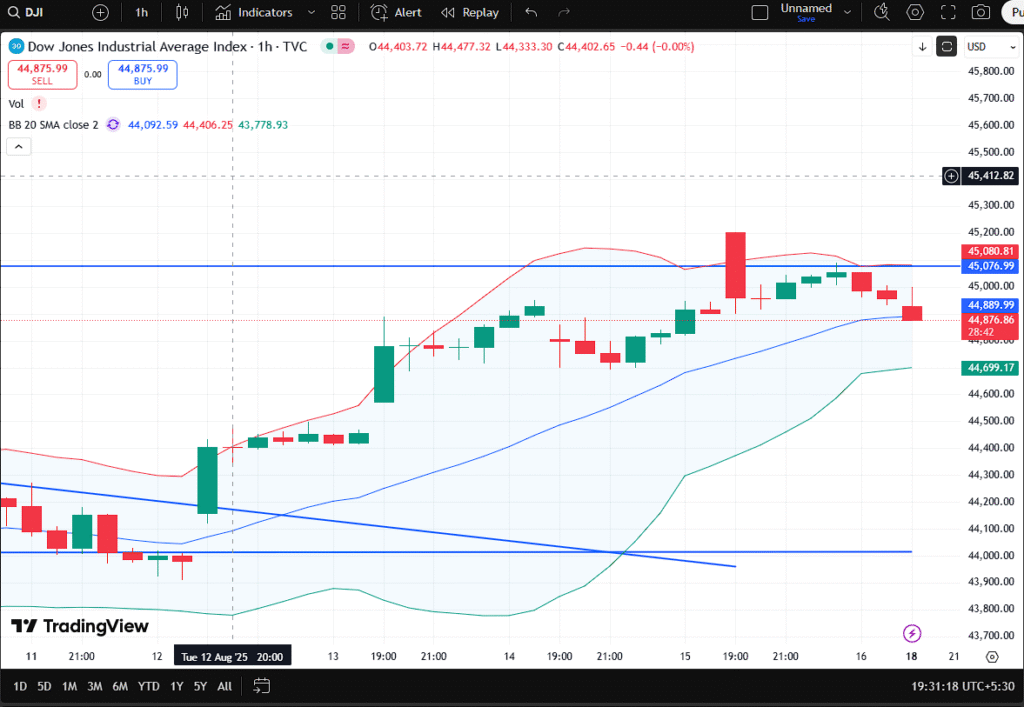
Dow Jones price chart showing resistance levels in August 2025.
Current Developments: A Tense Trading Session
The intraday candlesticks reveal an early attempt to push higher, which was rejected around 45,080, leading to a sequence of red candles. This indicates profit-taking near the resistance zone. Market participants are watching closely because the Dow has been hovering near recent highs, but momentum seems to be weakening.
Several factors are influencing sentiment:
- U.S. Federal Reserve outlook: Traders are split on whether another rate hike will arrive before year-end.
- Corporate earnings season: Mixed results from industrial and tech-heavyweights are creating uncertainty.
- Global macro risks: Oil price fluctuations and ongoing trade discussions continue to affect investor psychology.
Social media chatter also reflects cautious optimism. Some analysts argue that the pullback is just a healthy pause before another leg higher, while others warn that a break below 44,700 could trigger a deeper retracement.
Technical & Fundamental Analysis
From a technical perspective, the Dow Jones shows the following key patterns:
- Bollinger Bands:
- The price is currently near the mid-band (44,699).
- The upper band at 45,080 acted as resistance, and the failure to break above it suggests consolidation.
- If the Dow holds above the middle band, bulls still have control.
- Moving Averages:
- The 20-SMA (44,406) is acting as immediate short-term support.
- The 50-SMA lies further below near 44,100, providing a secondary safety net.
- Price remains above these averages, signaling that the broader trend is still bullish.
- Volume Action:
- A sharp red candle on high volume indicates selling pressure near the 45,100 zone.
- Follow-through selling will be critical to confirm a bearish shift.
- Momentum Indicators (RSI, MACD — not shown but inferred):
- RSI likely cooling from overbought levels, hinting at short-term consolidation.
- MACD histogram expected to flatten, reflecting slowing momentum.
Risks and Challenges
- Breakdown Risk: A close below 44,400 could open the door to 44,000 and possibly 43,800.
- Macro Uncertainty: Upcoming Fed speeches may trigger sharp intraday volatility.
- False Breakouts: Given thin summer liquidity, price whipsaws around resistance zones are possible.
Expert Opinions & Market Sentiment
Market analysts remain divided:
- Ed Yardeni (Yardeni Research) recently noted that U.S. indices remain “in a broad uptrend, but overextended in the short term,” advising traders to stay cautious near resistance zones. [Source: CNBC]
- Mohamed El-Erian highlighted that while U.S. equities have been strong, “bond market signals are flashing caution,” suggesting investors should brace for volatility. [Source: Bloomberg]
- On social media platforms like X (formerly Twitter), traders widely mention 45,100 as the critical breakout zone — if it holds, momentum could return quickly.
This mixed sentiment underscores the fragile balance between optimism and caution.
Future Outlook / Predictions
Looking ahead, three scenarios seem most likely:
- Bullish Case (Breakout Above 45,100)
- Dow breaks resistance and heads towards 45,400–45,500.
- Triggered by strong earnings or dovish Fed comments.
- Bearish Case (Breakdown Below 44,400)
- Increased selling pushes Dow towards 44,000–43,800.
- Triggered by higher bond yields or geopolitical tensions.
- Neutral / Sideways Case (Range-Bound 44,500–45,100)
- Consolidation continues with choppy intraday action.
- Traders rotate into selective sectors, keeping the index in check.
Given the current chart setup, the neutral-to-bullish scenario appears slightly more probable unless external shocks drive panic selling.
Conclusion & Call-to-Action
The Dow Jones Industrial Average is at a make-or-break juncture. While the medium-term trend remains bullish, short-term candles highlight profit-taking near key resistance. Traders should keep an eye on 44,700 as support and 45,100 as resistance. A breakout or breakdown will likely dictate the next 500-point move.
If you found this analysis useful, consider sharing it with fellow traders and leaving your comments below. For deeper insights, you may also read our detailed posts on:
Disclaimer
This article is for informational purposes only and should not be taken as financial advice. Always consult a registered financial advisor before making investment decisions.


Bet88 Casino, huh? Classic! Hoping they’ve got all the usual games and maybe some unique ones too. Will definitely be checking out bet88casino soon!
Durch Drücken der Schaltfläche Alle Spiele im Menü erhalten die Spieler Zugriff auf die
schier unglaubliche Auswahl an Spielen. Die Auswahl an Spielen auf Woo Casino ist einfach überwältigend.
Für die Auszahlungen stehen zudem sogar noch mehr
Anbieter zur Auswahl, als für die Einzahlungen, sodass hier jeder Spieler eine geeignete Zahlungsart finden sollte.
Leider ist nicht jedes Angebot für Glücksspiele in Deutschland legitim,
weshalb man sich vorher gut über den Anbieter informieren sollte.
Zusätzlich gibt es aber auch einige weniger bekannte Spiele wie Würfelspiele, Glücksräder und Gameshows.
Das Casino hat natürlich auch alle traditionellen Tisch- und Kartenspiele im Angebot, die man von einem echten Casino erwarten würde.
Damit Sie den Einzahlungsbonus jedoch bekommen, müssen Sie
dafür einen Bonus Code eingeben. Das bedeutet, dass Sie sich hier 200 Freispiele
und 200 Euro Echtgeld holen können. Neukunden können sich hier auf einen Bonus von bis zu 200 Euro und 200 Freispiele freuen. Fühlen Sie sich wie ein Pionier, wenn es darum geht,
Informationen über faszinierende Casino Bonus zu erhalten!
References:
https://online-spielhallen.de/casino-bregenz-login-ihr-zugang-zum-glucksspiel-erlebnis/
Aus Gründen der Nachhaltigkeit wird das Wasser des Innenpools nur auf 26
ºC erwärmt. Dieses klimatisierte Zimmer für 3 Personen verfügt über
einen Flachbild-Kabel-TV, ein eigenes Bad und einen Balkon mit Gartenblick.
Die geräumige, klimatisierte Suite bietet
einen Flachbild-Kabel-TV, schallisolierte Wände, eine Minibar und
einen Sitzbereich. Diese Suite bietet ein eigenes Bad mit einer Badewanne oder einer Dusche,
einem Bidet und einem Haartrockner sowie kostenlose Pflegeprodukte und Bademäntel.
Dieses Familienzimmer hat ein eigenes Bad mit einer
Badewanne oder einer Dusche, einem Bidet, einem Haartrockner,
kostenlosen Pflegeprodukten und Bademänteln. Die Suite verfügt über einen separaten Wohnbereich mit Sofas und Chaiselongue vor
einem Flachbild-TV.
Genießen Sie den Ausblick von der neuen Panoramaterrasse und versuchen Sie am Abend Ihr Glück im hoteleigenen Casino.
In Traumlage auf einem Felsen mit toller Aussicht auf Funchal und den Hafen.
Außerdem sind rollstuhlgerechte Zimmer mit barrierefreiem Badezimmer buchbar.
Für besonderen Komfort in den Badezimmern sorgen Kosmetikartikel.
Die Gäste können den Meerblick von Balkon oder Terrasse genießen.
References:
https://online-spielhallen.de/kingmaker-casino-auszahlung-ihr-umfassender-leitfaden/
Looking for a reliable Sv388 link? Sv388link seems legit. Got me where I needed to go without any hassle. If you need it, here it is: sv388link
It is easily launched in just a couple of clicks on popular
Australian casinos. Progressive jackpot slots such as Mega Moolah
and Divine Fortune are especially popular. Video slots that feature modern graphics and attract the attention of modern gamblers are
also especially popular. However, at the same time, it creates difficulties in finding these suitable titles among the many offers.
Microgaming, one of the pioneers in the field of online gaming, is known for its extensive portfolio, including games such
as Mega Moolah and Immortal Romance. These are the main advantages of mobile slots because
they allow you to access anytime, anywhere, and have an optimized gaming experience.
They are designed for quick withdrawals, which makes them popular among players who are looking for fast payout online pokies Australia.
For those who want to play without betting on real money, a great alternative is free pokies no
download. For those who prefer gambling for real money, online pokies real money is
the best option in Australia. Once you’re registered, you can choose from
a wide variety of games, including high-payout
slots, blackjack, roulette, and live poker.
References:
https://blackcoin.co/craps-tutorial/
“After introducing LLM-powered chat answers on Bing in February of last year, we’ve been hard at work on the ongoing revolution of search. Curiously, this new experience doesn’t appear to use the Copilot brand anywhere. The new Bing Generative Search experience is rolling out to a small wave of users now, and will likely make its way to more Bing users over the coming months. The company claims this new experience maintains the same number of clicks to websites that traditional search does, but time will tell if that’s true.
On average, new discussions are replied to by our users within 5 hours On average, new discussions are replied to by our users within 3.6 hours ( I’ve read a few forum lnks, same problem, though no apparent answer). It would be good to know if Sky are looking at this issue, which appears to be affecting quite a few people.
References:
https://blackcoin.co/reasons-that-make-online-casinos-all-the-more-interesting/
Points can be used to pay for almost everything at Crown Melbourne and Crown Perth, like shopping, dining, gaming,
hotel stays and much more. Enjoy the excitement of the casino, stay at one of
Crown’s world-class hotels or dine at award-winning restaurants.
From acclaimed restaurants and award-winning hotels to world-class gaming and endless entertainment, Crown Rewards helps
you to discover the world of Crown – and be rewarded.
Offering world-class spa therapies, holistic rituals, and premium
facilities, Crown Spa invites you to relax, restore, and rejuvenate.
Step into a sanctuary of peace and luxury at Crown Spa Melbourne
— one of Australia’s most exclusive wellness destinations.
Visit Concierge for store guides, personal shopping
services, or tax-free shopping information for international guests.
Enjoy relaxed shopping with extended hours, valet parking, and indoor walkways connecting shops, restaurants, and the casino floor.
Crown Melbourne is home to a hand-picked collection of
high-end boutiques offering the latest in fashion, accessories, and lifestyle.
We have strengthened our collaboration and information sharing with key partner agencies so that we have access to the most up-to-date intelligence.
We use and analyse intelligence, data monitoring and other information to spot
and target high-risk areas for criminality and gambling harm at the casino.
Crown is required by the VGCCC to publish a Public Status Report (PSR) twice
a year on its progress towards meeting the commitments in its Melbourne
Transformation Plan (MTP).
References:
https://blackcoin.co/34_best-no-deposit-poker-bonuses-and-free-poker-bankrolls_rewrite_1/
Betfair is the world’s biggest betting exchange,
allowing you to bet directly against other players. Have a look and see what gives All Slots casinos the edge over its competitors.
Offering a welcome bonus worthy of its name, Casino Tropez thinks big when it comes
to bonuses and rewards. It accepts POLi, offers an excessive amount of pokies and has 24/7 customer support – by providers that are based in Australia, no less.
This site has top drawer customer service as well as a wide variety of games.
Its sleek interface ensures a seamless real-money gaming experience on both
Android and iOS. All the casinos featured and recommended by us are legitimate options for Canada players.
Every online casino with a proper licence from a recognised authority, like that of the Kahnawake Gaming Commission, is considered a
legitimate operator.
References:
https://blackcoin.co/ripper-casino-no-deposit-bonus-codes-australia/
casino sites that accept paypal
References:
http://workompass.com/employer/10-best-android-casinos-for-us-players-reviewed-in-2025/
online betting with paypal winnersbet
References:
https://joblinksolution.org/employer/online-casinos-that-accept-paypal-usa-high-5-casinos
online casino paypal
References:
spandexjobs.com
paypal neteller
References:
jokakiki.shop
paypal online casinos
References:
http://jobs.recruithub.africa/profile/virgilhertzog
gamble online with paypal
References:
https://jobflux.eu/employer/316893/australian-online-slots-for-real-money-pokies-online-blackjack-online-in-australia
43bet, huh? Jumped in the game and I gotta say, its got a good vibe. Interface is really intuitive and the selection is pretty on point. Worth a peek if you feeling lucky. 43bet
Bet200, not bad, not bad at all. Easy to navigate and I found some competitive odds. Worth checking out if you’re in the mood for a gamble. bet200
Tried my luck at M88casino and had a blast! They have a good selection of games. I’d reccomend it for sure. m88casino