

Introduction
Bitcoin (BTC/USD) faced profit-taking pressure after briefly touching $120,000, leading to a pullback towards $117,800. The cryptocurrency had rallied sharply in the past week but now shows signs of consolidation. Technical indicators such as Bollinger Bands and volume patterns suggest the market may be entering a short-term corrective phase before deciding the next major trend. Traders are watching crucial support and resistance zones closely, as a decisive move could determine whether Bitcoin resumes its upward trajectory or corrects further.
Bitcoin Struggles Near $120,000 Psychological Resistance
After a strong upward rally fueled by bullish sentiment, Bitcoin hit a key resistance zone around $120,000–$121,000 before reversing. On the daily chart, BTC saw a sharp spike in trading volumes as sellers emerged at higher levels, triggering a pullback. The Bollinger Bands have widened significantly, reflecting heightened volatility.
Currently, BTC is hovering near $117,800, which aligns with the middle Bollinger Band support. A deeper retracement could test the $115,500 zone, where the lower Bollinger Band sits. On the upside, $120,000 remains the critical breakout level, while $125,000 would be the next major target if bullish momentum returns.
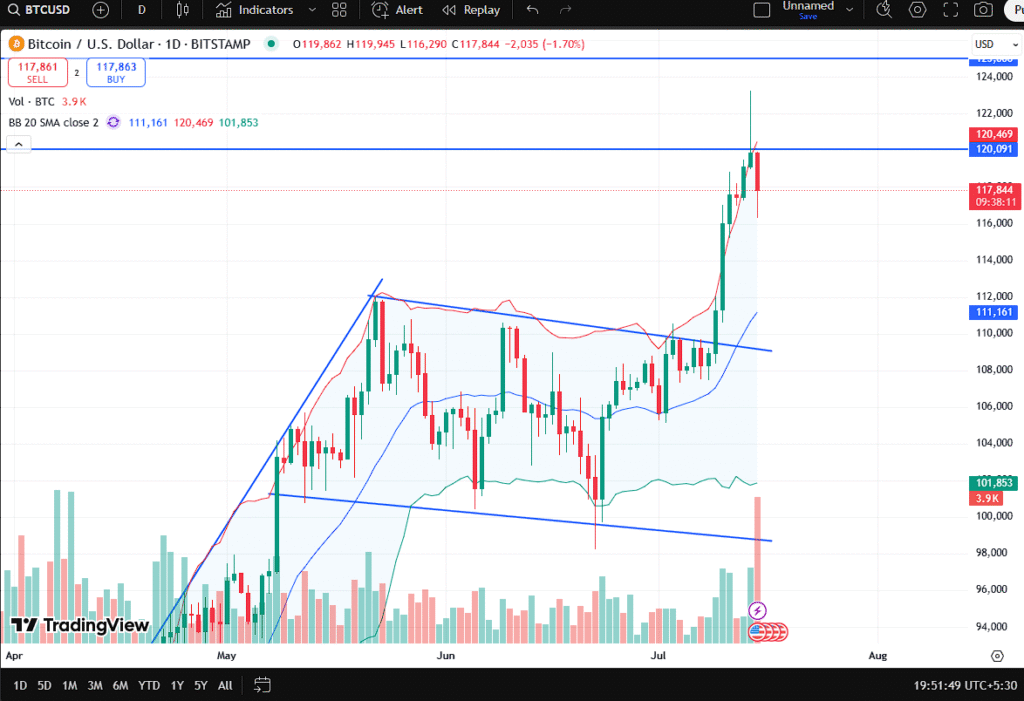
“Bitcoin daily chart shows a pullback after testing the $120,000 resistance zone, indicating potential short-term consolidation.”
The recent surge came after a prolonged consolidation phase between $98,000 and $110,000, followed by a breakout that attracted fresh buying interest. However, such parabolic moves often face profit-taking, especially near psychologically important levels like $120,000.
“Bitcoin’s rally towards $120K was impressive, but overbought conditions triggered a natural correction. As long as it holds above $115K, the bullish structure remains intact,”
said a crypto market analyst from a leading digital asset research firm.
On the hourly chart, BTC is attempting to stabilize after forming a short-term descending channel. The recent bounce suggests buyers are stepping in near $116,000, but strong resistance is expected around $118,500–$119,000, where the upper band and trendline converge.
The volume spike during the pullback indicates active selling, but the lack of follow-through suggests this may be a healthy correction rather than a trend reversal.
Short-Term Trend Shows Bearish Bias but Long-Term Outlook Remains Bullish
From a short-term perspective, Bitcoin’s hourly chart shows a falling channel pattern, which often acts as a continuation pattern in an uptrend. If BTC manages to break above $118,500–$119,000, it could resume its upward move toward $120,500 and beyond. Conversely, a breakdown below $116,000 may extend the correction towards $114,000–$113,500.
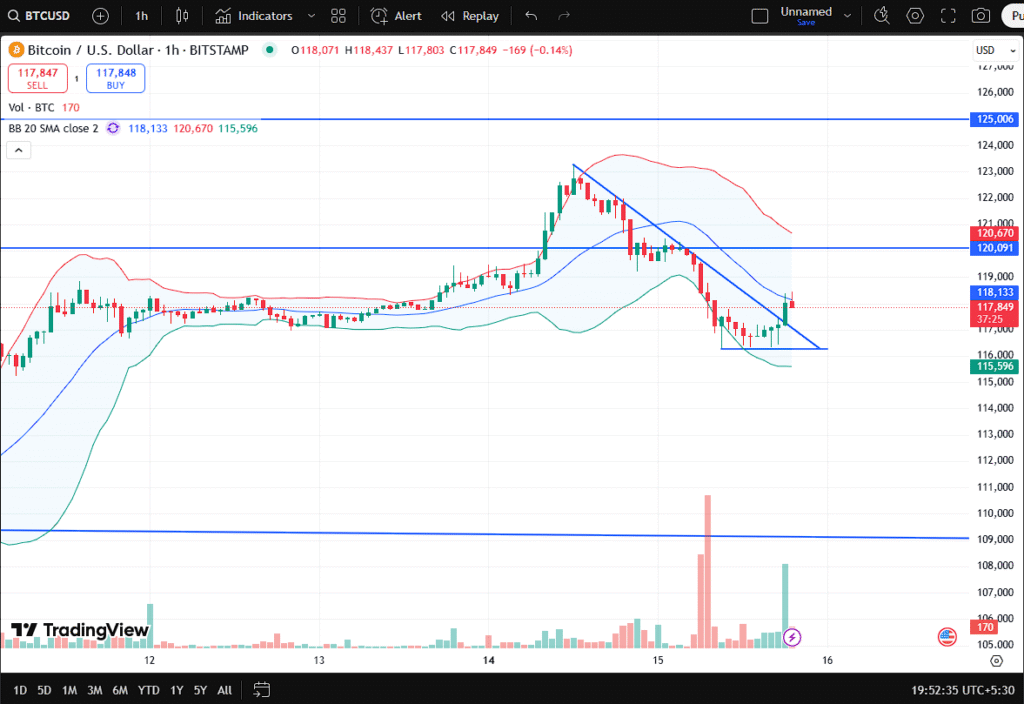
“Bitcoin hourly chart shows a descending channel with key breakout levels near $118,500 for the next move.”
Despite the short-term weakness, the longer-term bullish structure remains intact. On the daily timeframe, BTC is still above the 20-day SMA at $111,000, a crucial support for maintaining the medium-term uptrend.
Crypto traders are also closely monitoring on-chain metrics, which show increased whale accumulation during recent dips. This suggests that larger investors still believe in the upward potential despite short-term volatility.
Another factor influencing price action is the broader macro environment, including the US dollar index, global risk sentiment, and Bitcoin ETF inflows. A favorable macro backdrop could help Bitcoin reclaim its bullish momentum.
“We are witnessing a normal retracement within a strong uptrend. Long-term investors are using dips to accumulate, while short-term traders may see more volatility,”
commented a blockchain strategist.
Market Sentiment, Volume, and Key Catalysts Ahead
The crypto market as a whole is in a wait-and-watch mode, with altcoins following Bitcoin’s price action. Trading volumes on major exchanges remain relatively high, suggesting continued market participation.
Upcoming events that could impact BTC’s price include:
- US inflation data and Federal Reserve statements that may affect global liquidity conditions.
- Institutional buying activity, especially via spot Bitcoin ETFs.
- Technical factors, including the upcoming weekly close above or below $120K.
Insert Relevant Image Here
Caption suggestion: “Bitcoin’s next move depends on macroeconomic catalysts, institutional flows, and key technical levels.”
On-chain data continues to show strong holding behavior, with exchange reserves declining as more BTC moves into cold storage. This often signals reduced selling pressure, a positive sign for medium-term price stability.
In the broader crypto ecosystem, Ethereum and other large-cap altcoins have also seen similar pullbacks, suggesting a synchronized market correction rather than a Bitcoin-specific sell-off.
What Should Traders and Investors Do Next?
For short-term traders, it is essential to watch $118,500–$119,000 for signs of a breakout. A clear hourly close above this zone could trigger a retest of $120,000, while failure may keep BTC range-bound or push it lower toward $115,000.
For long-term investors, the dip presents an opportunity to accumulate Bitcoin at a relatively lower level, provided the medium-term support at $111,000 remains intact.
Insert Relevant Image Here
Caption suggestion: “Bitcoin pullback offers potential dip-buying opportunities, but traders should monitor key support and resistance levels.”
Traders are advised to maintain strict stop-loss levels due to the highly volatile nature of Bitcoin. Hedging strategies and diversified portfolios are recommended to manage risks effectively.
Looking ahead, if Bitcoin sustains above $120K, it could trigger a new wave of bullish momentum targeting $125K and beyond. However, if bearish sentiment deepens, a correction toward $112K–$110K cannot be ruled out.
Final Outlook
Bitcoin’s rejection near the $120,000 psychological resistance is a natural pullback after an extended rally. Technical charts suggest short-term consolidation within $116,000–$120,000, with a potential breakout once the market digests recent gains.
- Bullish scenario: A breakout above $120K opens the door to $125K.
- Bearish scenario: A breakdown below $115K may lead to deeper correction toward $111K.
Overall, the long-term trend remains positive, but near-term volatility will test traders’ patience.
Disclaimer:
This article is for educational and informational purposes only and should not be considered financial advice. Cryptocurrency markets are highly volatile. Always consult a professional financial advisor before making investment decisions.


Your article helped me a lot, is there any more related content? Thanks!
Alright, I gave 8day11 a whirl. Graphics are solid and everything loads quick. Could use some more variety in the games, but not bad overall. Check it out and let me know what you think!
Ein Casino mit Bonus bietet dir attraktive Angebote, die dein Spielerlebnis
bereichern. Viele Spieler nutzen den Willkommensbonus im Casino,
um sich Picks an der Bonus Crab zu sichern und ihr Spielerabenteuer zu
beginnen. Oftmals wird der Casino Bonus Crab als Teil von Willkommensaktionen, Neukundenboni oder regelmäßigen Promotionen angeboten. In einem sogenannten „Cash Crab Casino“ wird
ein Greifautomat eingesetzt, der den Spielern die Chance auf weitere Gewinne bietet.
Das Feature verschafft dir nicht nur Nervenkitzel, sondern die Aussicht auf zusätzliche Boni.
Das „Jahrmarkt Greifarm“-Spiel ist eine bestimmte Art von Bonusspiel
in Online Casinos mit Bonus Crab, die in einigen Online-Casino-Spielen vorkommt.
Diese Tabelle bietet eine Übersicht über einige der bekanntesten Online-Slots, die in Online Casinos mit Bonus Crab
Spielen ein „Bonus Crab“-Feature oder vergleichbare Mechaniken beinhalten. Sobald es aktiviert ist, führt es die Spieler zu
einem separaten Bildschirm oder einer speziellen Spielphase,
in der sie zusätzliche Belohnungen und Gewinne erzielen können. „Bonus Crab“ ist ein Minispiel innerhalb eines Spielautomaten, das normalerweise durch das Landen bestimmter Bonussymbole oder durch das Erreichen einer spezifischen Spielbedingung ausgelöst wird.
„Bonus Crab“ ist eine spezielle Art von Bonusspiel, das
in einigen Online-Casinos verfügbar ist, insbesondere an virtuellen Spielautomaten (Slots).
Mit 19 unterschiedlichen Zahlungsanbietern deckt Rolling Slots alle nur möglichen Zahlungsmöglichkeiten ab.
References:
https://online-spielhallen.de/frumzi-casino-bewertung-eine-tiefgehende-analyse-fur-deutsche-spieler/
Az888bet1, eh? The name sounds promising. Anyone had any luck on here? I’m thinking of giving it a try and seeing if I can win big! Join me? az888bet1
The platform’s gaming library features certified Random Number Generators (RNG) audited by independent testing laboratories.
The platform imposes no withdrawal fees on its end, though
payment providers may charge their standard rates. PayID withdrawals process within 1-3 hours for verified accounts, transforming the traditional 3-5
day wait into a same-day reality. Minimum deposits start at just $20 AUD, making the platform accessible whether you’re testing the waters or ready
to dive deep.
The platform’s game aggregation system delivers smooth performance across all devices without requiring
software downloads. This diverse approach ensures regular content updates while providing players access to unique titles unavailable at many
competing casinos. Aviator leads this category as the most popular crash game, challenging
players to cash out before the plane crashes. Bar Roulette 2000X presents Lucky Green’s most unique live offering, combining
traditional roulette gameplay with enhanced multiplier potential.
Evolution Gaming and Pragmatic Play Live power the majority
of live games, including multiple blackjack variants, European and
American roulette, baccarat, and poker games.
The pokies selection dominates the library with over
1,800 titles spanning classic three-reel slots, modern video slots, and progressive jackpot games.
References:
https://blackcoin.co/spinstralia-casino-a-comprehensive-review/
After the wagering requirements have been met, the
player can only withdraw funds up to the predetermined limit while the remaining balance is considered void.
Winnings from no deposit bonus funds and free spins must be wagered a specific number of times before
a withdrawal request can be sent. Regular account holders can apply NDB codes by
opening the Deposits section and typing the code in the corresponding field.
Games with return-to-player (RTP) scores of 95% and more are ideal for pursuing wagering requirements, as they will eventually return most of your wagers over
longer sessions.
Most online casinos that provide video poker include a few different variants, like
Texas Hold‘Em, stud poker, and Jacks or Better. Roulette is a table game which many casino players enjoy, with its simplicity often seen as the main driver of its popularity.
Seen as the most popular casino game, due to their easy gameplay
and random nature, slots often make up the bulk of
an online casino library. Make sure to read & understand the full
terms & conditions of this offer and any other bonuses at
Sky Vegas before signing up. Alongside Paddy Power, although not quite as good an offer, Betfair Casino also has a free
spins offer for new players. As always, you should read the full terms & conditions of
the Paddy Power bonus, and other offers, at Paddy Power Games before signing up.
Stay Casino offers new signups a free pokie
bonus worth A$20, claimable via the exclusive code “WWG20FREE”.
They represent strong options for players looking for fair and worthwhile no
deposit offers. With a no deposit bonus, you won’t need to
put any money down and the casino will deposit a specified amount of money
into your online casino account. With a no deposit bonus offering, casinos are hoping to lure you in as a loyal and long-term customer.
References:
https://blackcoin.co/supraplay-casino-comprehensive-review/
online casino paypal
References:
classihub.in
us online casinos that accept paypal
References:
http://vv4bi6jvuj.kr/
casino sites that accept paypal
References:
https://swav.sa/employer/10-best-online-casinos-australia-for-real-money-gaming-in-2025/
casino paypal
References:
https://glimpsonworld.com/employer/479/home
**mitolyn official**
Mitolyn is a carefully developed, plant-based formula created to help support metabolic efficiency and encourage healthy, lasting weight management.
Can you be more specific about the content of your article? After reading it, I still have some doubts. Hope you can help me.
Can you be more specific about the content of your article? After reading it, I still have some doubts. Hope you can help me. https://accounts.binance.com/hu/register?ref=IQY5TET4