

Introduction
Bitcoin, the world’s largest cryptocurrency by market capitalization, is currently trading at a critical juncture. Technical indicators suggest a tight consolidation phase near key resistance levels, setting the stage for either a powerful breakout or a sharp fakeout. With Bollinger Bands tightening and price flirting with the upper band, traders are on high alert for the next big move. The daily chart analysis indicates a period of low volatility might soon give way to heightened action—bringing both opportunity and risk.
Bollinger Bands Squeeze Signals a Volatile Move Ahead
The Bollinger Bands indicator, widely used by technical traders to gauge volatility and potential breakouts, is showing signs of compression on the BTC/USD daily chart. Historically, when the bands squeeze, it signals a buildup of pressure—often followed by an explosive move in either direction.
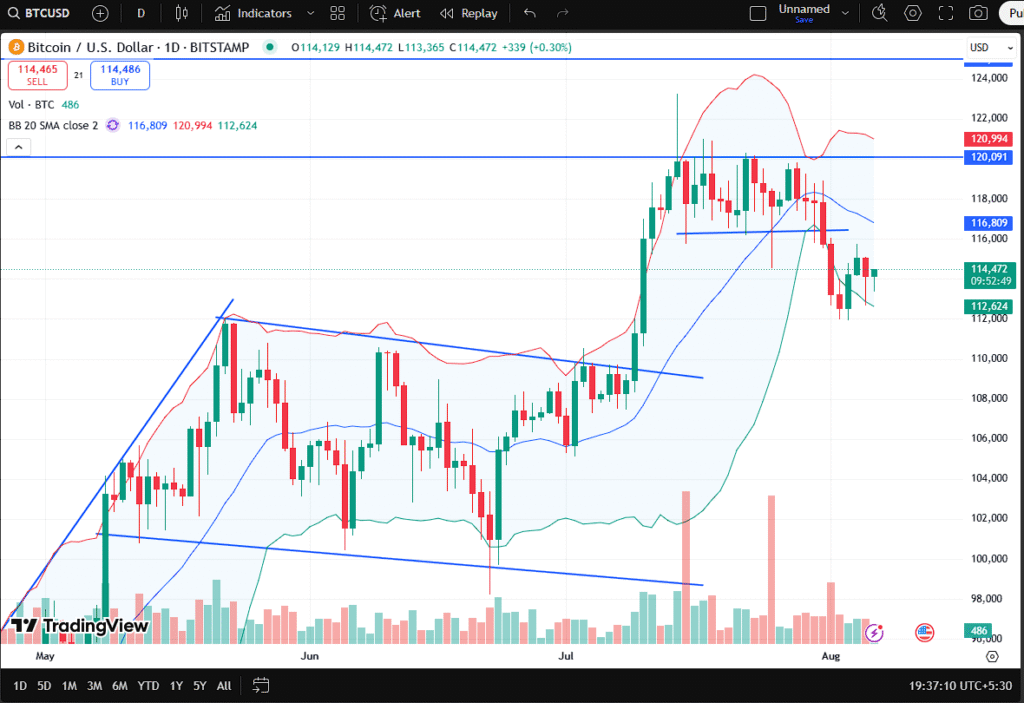
Daily BTC/USD chart showing Bollinger Bands squeeze and resistance zone testing.
In the current scenario, Bitcoin is consolidating between the $57,800 to $59,200 range, hovering just below a crucial resistance trendline drawn from the last major swing high. The Bollinger Bands have narrowed significantly, and the price is hovering at the upper band, indicating bullish attempts to break out.
However, fakeouts are common during such setups, especially when low volume accompanies an upward thrust. Traders remember similar conditions in previous cycles—particularly in 2021—when Bitcoin faked a breakout before plunging into a mini correction.
Volume confirmation remains the key. If Bitcoin breaches above the resistance line with significant trading volume, the breakout could be genuine, pushing prices above $60,000. However, failure to sustain momentum could lead to a quick rejection and a fall back to the $56,000–$55,500 support zone.
Breakout or Fakeout? Traders Remain Cautiously Optimistic
The crypto market thrives on speculation, and Bitcoin is its pulse. With technical setups aligning for a possible directional move, the bulls and bears are in a state of strategic waiting. The recent candle formations near the resistance suggest indecision—wicks at the top of the candles reflect rejection at higher levels, while long lower wicks show buying interest at dips.
One veteran trader, known as @CryptoSurge on X (formerly Twitter), commented:
“This is textbook Bollinger squeeze behavior. If the breakout doesn’t come in the next 2-3 sessions, we might witness a liquidity grab followed by a violent pullback.”
This sentiment is echoed across many trading forums. The RSI (Relative Strength Index) is hovering near neutral territory (50–55 range), providing no clear bias. MACD lines are converging, but not yet offering a confirmed bullish crossover.
In simpler terms: the setup is ripe, but confirmation is key. Long-term investors may hold through the noise, but short-term traders are better off waiting for a candle close above the $59,500–$60,000 zone with strong volume and a bullish RSI divergence.
Historically, such setups have led to either:
- A clean breakout followed by a $3,000–$5,000 rally
- A fakeout above resistance followed by a swift drop of 5–7%
With altcoins also showing mixed signals, Bitcoin’s next move will likely set the tone for the broader crypto market in the coming days.
Market Sentiment and Macro Factors Driving BTC Price
While technicals dominate day-to-day charts, the broader sentiment and macroeconomic conditions continue to influence Bitcoin’s price trajectory. August 2025 has so far seen a cautious tone in the markets, with the U.S. Federal Reserve maintaining its hawkish stance on interest rates. Inflation numbers, though under control, still keep the market on edge.
Bitcoin’s correlation with the NASDAQ and tech stocks also plays a role. A strong equity rally may aid BTC’s breakout attempts. Conversely, any equity market correction could drag BTC lower, regardless of technical signals.
Moreover, ETF inflows have been inconsistent in recent weeks. Analysts at CryptoQuant pointed out that:
“Bitcoin ETFs have seen reduced inflows, signaling institutional hesitation at current levels. This may limit upside until macro clarity emerges.”
Additionally, on-chain metrics show decreasing exchange reserves, indicating that long-term holders continue accumulating. This is a positive sign for the longer-term price action, but short-term uncertainty remains.
What’s Next for Bitcoin? A Key Week for Directional Confirmation
The coming week is critical for Bitcoin. Whether it finally breaks above the $60,000 psychological barrier or retreats to test lower supports will likely depend on two key elements: volume and macro news catalysts.
If bulls manage to push prices past the resistance zone with strength, the next targets lie at $62,800 and then $65,000. This would rekindle the bullish narrative and may pull altcoins along for the ride.
However, a failed attempt could see Bitcoin fall to $55,500, with a worst-case scenario of testing the 200-day moving average near $52,000. Traders must remain alert to signs like:
- Sudden spikes in volume
- RSI crossing 60–65
- MACD confirmation
- News-driven volatility (e.g., Fed updates, geopolitical events)
Long-term HODLers need not panic unless BTC breaks the major trendline support below $50,000. For short-term traders, risk management is essential during such uncertain setups.
Final Thoughts: Volatility Ahead, Strategy is Key
Bitcoin is standing at a fork in the road. With technicals flashing warning signs and opportunity alike, the smart approach is to wait for clear confirmation before taking a position. Breakouts without volume often trap traders, while confirmed moves can deliver significant gains.
With the Bollinger Bands compressed, price action near resistance, and global markets in flux, Bitcoin’s next 7–10 days could shape the tone for the rest of Q3 2025.
Whether it’s a fakeout or a true breakout—stay alert, manage risk, and follow the charts, not the noise.
Disclaimer:
This article is for informational purposes only and should not be considered financial advice. Cryptocurrency trading involves high risk. Please consult a financial advisor before making any investment decisions.
Dow Jones Wobbles Near 44,100: Bounce or Breakdown After Mid-Bollinger Band Retest?


gi88, huh? The name’s catchy. Hoping the site lives up to the name. Ease of use is key for me. Anyone have experience? Check it out: gi88
Your point of view caught my eye and was very interesting. Thanks. I have a question for you. https://accounts.binance.com/en/register-person?ref=JHQQKNKN
Anyone heard of wim444? Seems to be connected to winn444. I’m curious. Going to give it a try. Here’s the link: wim444