

Introduction:
Bitcoin (BTC) is under pressure again, as recent daily charts signal a breakdown below a key resistance level near $116,000. With the price now hovering around $112,748, traders and investors are watching closely for the next major move. The Bollinger Bands are tightening, volatility is contracting, and the bulls have failed to reclaim the crucial mid-band resistance. Is this a healthy retracement or the start of a larger correction?
Bearish Rejection at Mid-Bollinger Band Indicates Selling Pressure
Bitcoin attempted to bounce back from recent lows, but its efforts were cut short at the $116,000 mark. This level, which coincides with the 20-day simple moving average (SMA) of the Bollinger Bands, acted as a strong resistance. The failure to break through this line suggests that sellers still dominate the market.
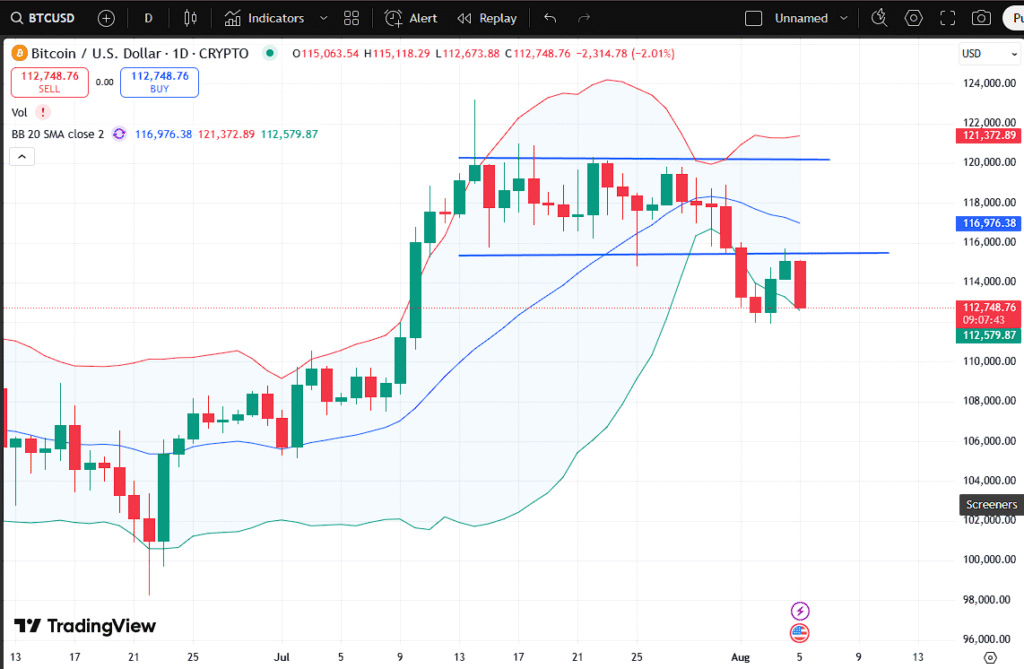
“Bitcoin daily chart showing rejection at mid-Bollinger band and breakdown below support.”
This rejection, coupled with the red candlestick seen in the latest session, confirms a bearish outlook in the short term. The Bollinger Bands are beginning to squeeze—a classic sign that a volatile move could be imminent. Currently, the price is trapped between a lower support at approximately $112,000 and the mid-band resistance at $116,976.
Analysts point out that if Bitcoin fails to hold the $112,500 zone, it may trigger a deeper slide toward the lower Bollinger Band, which currently hovers near $108,000. This scenario could further extend to psychological support near $105,000, especially if macroeconomic or regulatory news continues to pressure risk assets.
The Importance of $112K: Historical Support Now in Focus
In the past, the $112,000 level has acted as a bounce zone for Bitcoin, providing temporary relief during minor corrections. However, this time around, the support is being tested under more stressful technical conditions.
Over the last two weeks, BTC/USD has formed a lower high structure—a classic bearish indicator. The 20-SMA, which once supported the uptrend in July, has now flipped into resistance. Traders also point out that the current chart shows a classic “lower high and lower low” structure developing, confirming short-term weakness.
The breakdown from the mini-range ($116,000–$121,000) that lasted for nearly two weeks in late July has also put bulls on the defensive. Without a convincing reclaim of $116,000 in the coming sessions, buyers may remain cautious.
Volume analysis shows weakening bullish momentum. A breakout in early July saw a strong green candle supported by high volume, but current candles—both green and red—show reduced volume, suggesting waning interest or uncertainty among traders.
Macro Factors and Market Sentiment Dragging Bitcoin Lower
Beyond the chart, global macroeconomic factors are contributing to Bitcoin’s slide. The U.S. dollar has strengthened in recent sessions amid signs that the Federal Reserve may delay any interest rate cuts until Q1 2026. A stronger dollar typically pressures Bitcoin, which is seen as a hedge against fiat currency devaluation.
Furthermore, ongoing concerns about crypto regulation, particularly in the U.S., continue to create uncertainty. The recent rejection of multiple Bitcoin ETF applications by the SEC has also dampened sentiment.
Analyst Karen Mulrooney of CryptoMarketSignals stated, “We’re seeing a risk-off environment return. Equity markets are jittery, and Bitcoin is being treated more like a tech stock right now than digital gold. Unless Bitcoin finds fresh institutional demand or a macro catalyst, support zones like $108K or even $105K might be tested.”
Fear & Greed Index for crypto also dipped to 38 (Fear) from last week’s 51 (Neutral), signaling increased investor anxiety. This further aligns with the rejection at resistance, suggesting more pain could lie ahead if sentiment continues to deteriorate.
Outlook: Will Bitcoin Hold $112K or Crash Towards $105K?
The immediate focus remains on the $112,000–$112,500 support zone. If Bitcoin holds above this level and rebounds strongly, it could indicate a false breakdown and invite aggressive dip-buying. However, if sellers breach this level, the next support lies around $108,000 (lower Bollinger Band), followed by $105,000 (psychological level and June consolidation base).
Long-term investors may view this as an opportunity, but short-term traders should remain cautious. A decisive close below $112K could trigger further stop-loss cascades and panic selling.
Technical indicators also point to bearish momentum:
- RSI is trending downward but has not yet entered the oversold zone, suggesting more room for downside.
- MACD is showing a bearish crossover, reinforcing short-term weakness.
- Bollinger Band squeeze may lead to a sharp breakout or breakdown—currently favoring the latter.
For Bitcoin to resume its upward trend, a strong bullish close above $116,976 (mid-Bollinger Band) followed by a reclaim of $121,000 would be required. Until then, the short-term trend remains bearish.
Disclaimer:
This article is for informational purposes only and should not be considered financial or investment advice. Cryptocurrency investments are highly volatile and involve risk. Please conduct your own research or consult a professional before making investment decisions.


Alright lads, gave f16878vip a go last night. Not bad, a decent selection of games. Could use a bit more polish on the site, but the odds seem alright. Worth a punt if you’re looking for something new. Check ’em out! f16878vip
Oi, looking to snag the Superbet app, eh? Heard it’s pretty slick. Makes placing your bets on the go dead easy. Download’s straightforward enough. Here’s the link: superbet download
Your article helped me a lot, is there any more related content? Thanks!
Your point of view caught my eye and was very interesting. Thanks. I have a question for you.
Downloaded the 10betapp figured it was an easy option to get into the game on the go. I wouldn’t say it is a favorite, but I will use it. See what you think here: 10betapp
Thinking about trying the novibetapp. Seems like a convenient way to place bets directly from my phone. Any users have experience with this app? It couldn’t hurt to check it out! novibetapp
Okay, so I finally checked out novibetlogin, and honestly, it’s pretty straightforward. Got in, got playing, no real fuss. If you’re looking for something simple, give novibetlogin a try.