

Introduction:
Bitcoin (BTC) is inching closer to the $120,000 mark, a key resistance level that could determine its short-term direction. Over the past week, the world’s largest cryptocurrency has seen renewed buying interest, with bullish patterns forming on the daily chart. Traders are closely monitoring the $120,900 zone, where previous rallies have faced selling pressure. A confirmed breakout above this threshold could trigger a fresh leg higher, potentially setting new all-time highs, while failure to do so might invite sharp profit-taking.
Bitcoin Price Consolidates Below Major Resistance
Bitcoin’s recent rally has been marked by a series of higher lows, indicating sustained buying momentum. The daily chart shows BTC trading just below a horizontal resistance around $120,900 — a level that has capped upward movement multiple times over the past month. The price is currently supported by an ascending trendline and the 20-day simple moving average (SMA), both acting as short-term bullish indicators. The Bollinger Bands are tightening, a classic sign that a significant price move could be imminent.
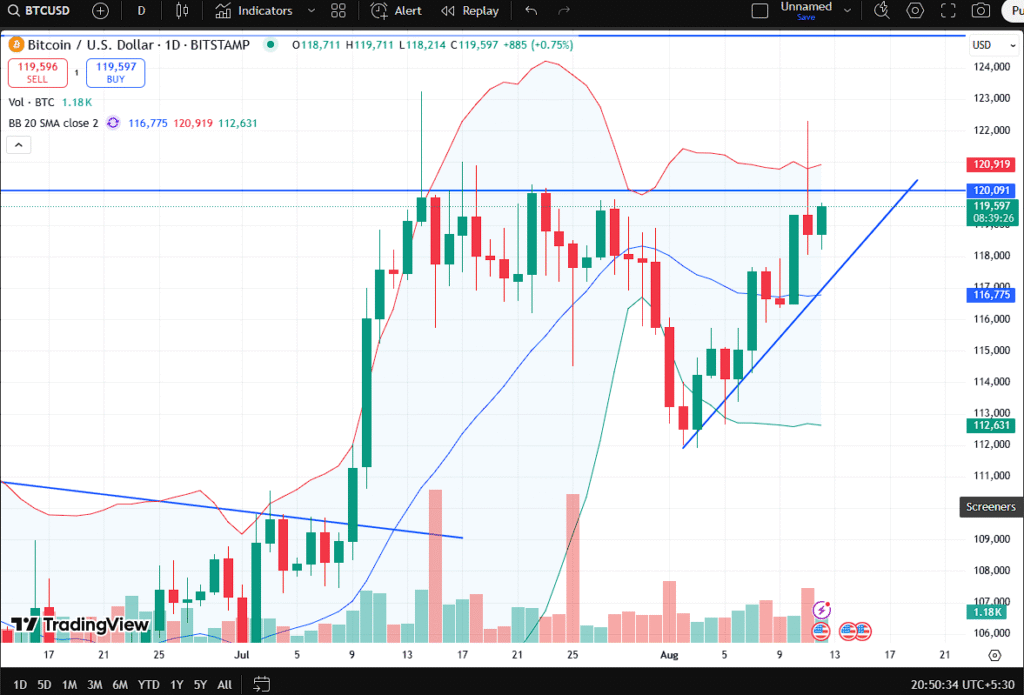
Bitcoin daily chart showing ascending trendline support and resistance near $120,900.
In technical analysis terms, the market structure remains bullish as long as Bitcoin stays above the $116,000–$116,800 zone, which aligns with the middle Bollinger Band. This area has repeatedly acted as a demand zone for traders looking to accumulate positions. Volume trends also reveal growing participation on up days, indicating that the latest upward moves are supported by genuine buying interest rather than low-liquidity spikes.
Market analysts, such as crypto strategist Michaël van de Poppe, have noted that Bitcoin’s ability to hold above $118,000 after multiple retests of support reflects strong resilience. “We are approaching a decision point,” van de Poppe said in a recent market update. “Either we break through and see an acceleration to new highs, or we face another rejection and retest the $112,000–$113,000 levels.”
Bullish Catalysts Driving the Market
One of the primary factors behind Bitcoin’s recent strength has been improving macroeconomic sentiment. With inflation in key economies showing signs of slowing and central banks hinting at a potential pause in interest rate hikes, risk assets such as cryptocurrencies are finding renewed favor among investors. Additionally, institutional demand remains strong, with spot Bitcoin ETFs seeing consistent inflows over the past two weeks.
On-chain data supports the bullish narrative. Glassnode reports that the number of Bitcoin addresses holding more than 1 BTC has reached an all-time high, indicating accumulation by retail investors. Furthermore, exchange reserves are at multi-year lows, suggesting that fewer coins are readily available for sale, which could add to supply-side pressure if demand continues rising.
Another important development is the upcoming Bitcoin halving, expected in less than a year. Historically, halvings have preceded major price rallies as the reduction in block rewards tightens new supply. Analysts believe this cycle could be no different, especially given the heightened interest from traditional finance and the broader adoption of Bitcoin as a hedge asset.
Technical Outlook: Breakout or Reversal?
From a chartist’s perspective, Bitcoin’s path in the coming days depends largely on how it interacts with the $120,900 resistance. A decisive daily close above this level, ideally accompanied by high trading volume, would be considered a breakout. In such a scenario, immediate upside targets could be $123,500 and $126,000, with the potential for a push toward $130,000 if momentum accelerates.
However, traders are also aware of the risk of a “fakeout,” where price briefly moves above resistance only to fall back below, trapping late buyers. The current ascending triangle pattern supports a bullish resolution, but if the trendline is broken and Bitcoin closes below $116,000, bearish momentum could take over, leading to a retest of $112,600 and possibly $110,000.
Outlook for the Coming Weeks.
Looking ahead, Bitcoin’s price movement is likely to be shaped by a combination of technical triggers and macroeconomic news. Any significant developments in the regulatory landscape — particularly regarding crypto ETFs and global taxation policies — could either fuel the rally or dampen sentiment. For now, the market appears cautiously optimistic, with traders positioning for a potential breakout but prepared for volatility.
If Bitcoin successfully breaks and holds above $120,900, the bullish momentum could attract a fresh wave of retail and institutional buyers. On the other hand, repeated failures at this level might shake short-term confidence, prompting a period of sideways consolidation before the next major move.
Disclaimer:
This article is for informational purposes only and does not constitute financial advice. Cryptocurrency investments are highly volatile and carry risk. Always conduct your own research before making any investment decisions.
Ethereum Smashes Past $4,400 as Bulls Eye New Record Highs: Is $5,000 Next?


Anyone having luck over at Bet117bet? Looking for a new site to try my luck on. How’s their customer support? Good bonuses? Check it out here: bet117bet
Gleiches gilt auch für Boni, mit denen Sie im Casino online
spielen können. Unsere aktuellen No Deposit Bonus Angebote
2025 für Deutschland & Österreich ermöglichen euch den direkten Start mit Gratis Freispielen oder gratis Bonusguthaben. Für Echtgeld Online Casinos
ist der Bonus ohne Einzahlung ein Marketinginstrument, das vor allem dazu dient, neue Spieler zu gewinnen. So testen Neuspieler die Casino-Funktionen und
Spielangebot risikofrei.
Dieser Feed ist derzeit nicht verfügbar, wird aber in Kürze wieder online
sein. Sie können Ihre No Deposit Freispiele oder Ihr
No Deposit Gratisguthaben nutzen, um Spiele in dem
von Ihnen gewählten Online-Casino auszuprobieren. Um einen dieser Boni zu erhalten, müssen Sie lediglich ein kostenloses Konto registrieren. Ein Echtgeld Bonus ist oft flexibler und für mehr Spiele
einsetzbar, deshalb sind Echtgeld Boni meist wertvoller für langfristiges Spielvergnügen und höhere Gewinnchancen. Freispiele ohne
Einzahlung bieten eine gute Gelegenheit, Online Slots
kostenlos zu testen und kleine Gewinne zu erzielen. So können Sie neue Casino Angebote in aller Ruhe testen,
bevor Sie sich entscheiden und Echtgeld einzahlen.
References:
https://online-spielhallen.de/betano-casino-cashback-so-holen-sie-das-beste-heraus/
100 % bis zu 100 € + 50 Freispiele bei der ersten Einzahlung.
Automatenspiele im seriösen Slots Casino haben einen sogenannten Random
Number Generator (RNG). Grundsätzlich können Sie Automatenspiele für das Umsetzen Ihres Bonus Guthabens verwenden. Automatenspiele mit Spielgeld sind wie eine Simulation, bei der Sie die Funktionsweise ausprobieren können.
Die Anbieter liefern ihre Spiele an Online-Casino-Betreiber, die diese wiederum Spielern weltweit anbieten, einschließlich Deutschland.
Während du deine gewählten Spielautomaten in Deutschland spielst, verfolge die Gewinnkombinationen und
lerne, wie sie erzielt wurden. Viele dieser Spiele bieten großzügige Auszahlungen,
was sie zu einer hervorragenden Wahl für Spieler macht.
References:
https://online-spielhallen.de/nine-casino-bonus-code-und-die-welt-der-vorteile/
Plusph11, huh? New one to me. Gonna take a look around. The layout is pretty clean. Hope the odds are good. Wish me luck! plusph11
Give that code to whoever you want to play with, they can use it to join. Click
Deal to start the game. And get the latest news on game releases and
daily challenges After each match, think about how you have performed and the potential steps you could
take to perform better in the next match or game.
If playing with friends, you could always ask them for some
advice before you start playing. For example, you could watch Backgammon tutorials or games on sites
such as YouTube to better familarize yourself with the
rules! However, if you are looking to put your skills to the test, you may want to play against another human player instead.
When playing 24/7 Backgammon, your home point is in the bottom
left corner of the screen. A die is used to raise the stakes when playing Backgammon. A prime is a series of six consecutive points occupied by your checkers.
This game is currently not ready for playing, it’s in beta testing right now,
we’ll announce when it’s ready. Please enter a name to display to other players You can always go back online by clicking on the Multiplayer button. If
you block a player they can no longer challenge
you to a game or join a table you are at. If you mute a player you won’t see any messages
they send during a game. No payouts will be awarded, there are no “winnings”, as all games represented by 247 Games LLC are free to play.
References:
https://blackcoin.co/4-top-tips-for-winning-big-at-online-poker/
Players earn loyalty points by playing real-money games and advancing through the ranks.
Here’s a quick summary of what makes King Billy Casino
stand out for Australian players, along with a few minor drawbacks.
Any inquiries about account verification, bonus
redemption, or technical issues are usually resolved quickly.
Moreover, Aussie players can opt for certain cryptocurrencies, preserving anonymity and enabling
swift processing.
Reliability, convenience, and attention to detail have
made the company a popular choice for both newcomers and
experienced users. We use dedicated people and clever technology to safeguard our platform.
Labeled Verified, they’re about genuine experiences.Learn more about other kinds of reviews.
Excellent withdrawals process, received funds INSTANTLY
Dear reviewer,We’re sorry to hear about your experience.
References:
https://blackcoin.co/craps-tutorial/
Before you start playing for real money at an Australian casino online,
it’s worth knowing which payment options offer the fastest, safest, and most reliable transactions.
When choosing a legit online casino in Australia, players should look for sites that are
licensed, secure, and known for fast payouts, substantial bonuses, and trusted security.
Online pokies (or online slots Australia players love) remain the most played games across local and offshore casinos online.
Our expert team compared game variety, welcome bonuses, fast withdrawals, customer support, and mobile-friendly
casinos to bring you the top 3 online casinos that stand out in 2025.
Looking for the best online casinos for real money in Australia?
Explore our list of legal gambling sites and start playing real-money
casino games from the Land Down Under.
You can choose from European or American wheels with different RTPs, while Auto Roulette offers
faster spins without a live host. Multiple camera angles, slow-motion replays, and live wheel spins let you
see every detail, even more clearly than when you’re sitting at a physical roulette table.
Infinite Blackjack removes seat limits entirely,
ensuring players can always join a table without waiting.
Popular options include Bet Behind and a range of side bets,
alongside faster games like Speed Blackjack, which reduces downtime between rounds.
You’ll find live dealer options with varied betting limits and built-in features that display live results, betting history, and recent big wins.
Built-in chat lets you interact with dealers
and other players, ask questions, or simply stay engaged as each round
unfolds.
This mix of entertainment and flexibility is what makes Australian live dealer casinos stand out.
He loves getting into the nitty gritty of how casinos and sportsbooks really operate in order to make solid…
Real money casinos in Australia are not quite legal, however the law allows for social casinos to operate.
References:
https://blackcoin.co/online-casino-bonus-guide-in-australia/
However, to ensure there are no trickery in the game, Australian LevelUp Casino has a Know Your Customer (KYC) policy.
Moreover, it is not necessary to use the application for mobile devices, the best mobile casino experience is
guaranteed through a web browser. Find real treasures,
Australian favourite pokies, sign in to Level Up casino to have
the best gaming experience. These apps are optimized for performance and include all the functionalities of the desktop version, allowing players to enjoy uninterrupted gaming on the go.
The support team is professional and responsive,
ensuring players receive prompt and helpful solutions.
References:
https://blackcoin.co/news-update-online-gambling/
paypal casino online
References:
http://www.dycarbon.co.kr
gamble online with paypal
References:
https://werkstraat.com/companies/best-paypal-casinos-updated-2025/
paypal casino online
References:
https://hirepestpro.com/employer/paypal-casinos-2025-best-online-casinos-accepting-paypal/
casino online uk paypal
References:
https://empleos.contatech.org/employer/online-casinos-that-accept-paypal-2025-nj-com/
online casinos that accept paypal
References:
https://i-medconsults.com/companies/best-payout-online-casinos-australia-2025-97-rtp-big-bonuses/
online casino that accepts paypal
References:
https://ahsazglobal.in/employer/payid-pokies-real-money-with-instant-withdrawal-play-online/
paypal casino online
References:
https://hirenhigher.co.nz/companies/best-payid-casinos-in-australia-2025-payid-online-pokies/
Your article helped me a lot, is there any more related content? Thanks!