
Introduction
Bitcoin (BTC) is once again standing at the crossroads, teasing traders with a potentially explosive breakout while keeping skeptics on their toes. Over the past few weeks, Bitcoin’s price action has been consolidating in a narrow range, indicating that a major move might be on the horizon. With macroeconomic uncertainty, increased institutional interest, and rising retail participation, market watchers are wondering — will 2025 be the year Bitcoin breaks past all-time highs, or will it face another harsh rejection?
In this article, we’ll explore why Bitcoin is currently at a critical turning point, examine the latest market data, analyze key technical levels from the August 2025 chart, share expert opinions, and consider the potential scenarios that could unfold in the months ahead.
Why Bitcoin Is at a Critical Turning Point
Bitcoin’s history is filled with sharp rallies and equally brutal corrections. Every consolidation phase in the past has been followed by a decisive move — either a strong upward trend or a prolonged downturn.
In late 2024, Bitcoin rallied close to $100,000 after a wave of institutional adoption, ETF approvals in multiple countries, and growing mainstream acceptance. However, after hitting resistance near this psychological level, BTC has been trading sideways, hovering between $92,000 and $98,000.
Historically, such prolonged consolidation near a key resistance level tends to precede significant market moves. For example:
- In late 2020, Bitcoin hovered around $19,000 before breaking above $20,000 and starting a historic rally.
- In early 2021, it faced resistance at $58,000 before a breakout pushed it toward $64,000.
- In 2019, consolidation near $13,000 led to a sharp rejection and a 40% drop.
With current volatility levels at multi-month lows, traders believe the next breakout — in either direction — could be decisive.
Key Bitcoin Data & Statistics (August 2025)
- Current Price: $121518
- 24-Hour Volume: $38.2 billion
- Market Cap: $1.9 trillion
- Resistance Levels: $125000
- Support Levels: $120,200, $116,000, $112,500
- RSI (Daily): 58 — neutral, but leaning bullish
- MACD (Daily): Slight bullish crossover forming
- Volatility Index: Lowest since March 2024
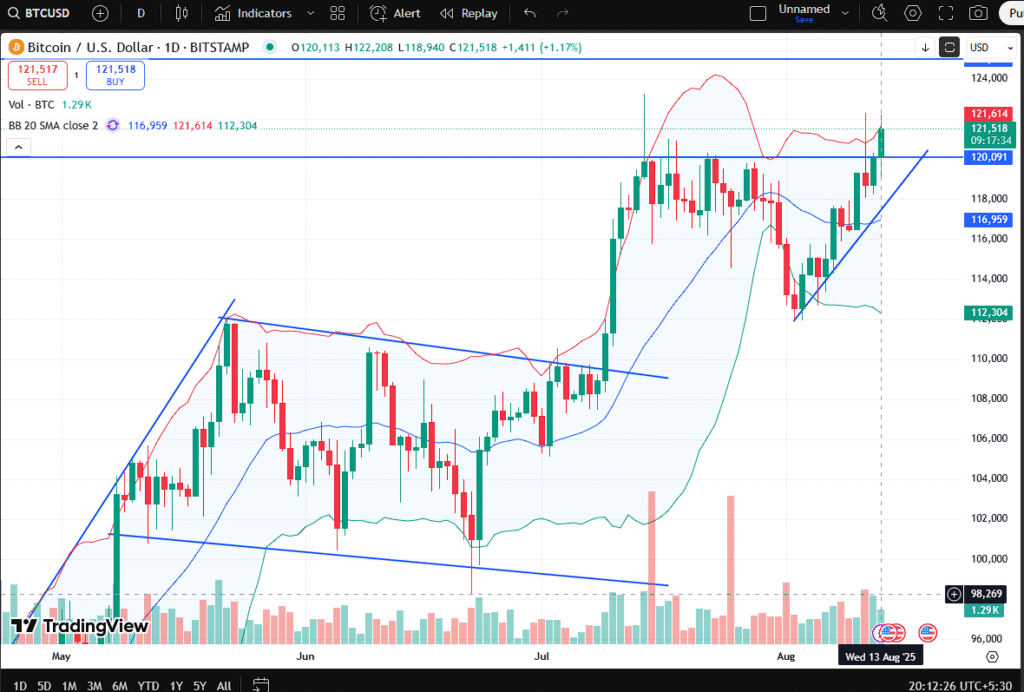
“Bitcoin price chart showing resistance levels in August 2025.”
Current Developments in the Bitcoin Market
The Bitcoin market in August 2025 is being shaped by a mix of global economic events and crypto-specific developments:
- US Federal Reserve Rate Policy: Traders are awaiting the next interest rate decision, with many expecting a slight rate cut to stimulate the economy. Historically, lower rates have been bullish for Bitcoin.
- ETF Inflows: The Bitcoin Spot ETFs approved in the US and Europe in 2024 have seen consistent inflows, signaling strong institutional demand.
- Mining Difficulty All-Time High: Despite the halving earlier this year, mining difficulty continues to increase, reflecting network strength.
- Geopolitical Tensions: Bitcoin is increasingly being used as a hedge in countries facing currency instability, driving adoption in emerging markets.
Technical and Fundamental Analysis
From a technical perspective, Bitcoin’s daily chart shows a clear ascending triangle pattern — a bullish formation where price makes higher lows while repeatedly testing a horizontal resistance line. This pattern often precedes an upward breakout.
- Resistance Zone: $98,500 is the key level. A breakout above this could trigger a rally to $102,000 and potentially $105,000.
- Support Zone: The $94,200 area has acted as a solid floor. If this breaks, traders will look to $92,000 as the next major support.
- RSI & MACD: The RSI at 58 suggests room for upside before hitting overbought territory, while MACD’s bullish crossover hints at momentum building.
- Volume Trends: Breakout attempts have so far lacked volume. A true breakout will likely be accompanied by a surge in buying activity.
From a fundamental perspective, Bitcoin’s scarcity (fixed supply of 21 million coins), combined with rising global inflation fears, is creating a favorable environment for long-term holders. Institutional participation via ETFs and treasury allocations from large companies are adding credibility to Bitcoin as a macro asset.
Risks and Challenges
- Macro Shocks: A sudden change in central bank policy or a global economic slowdown could hurt risk assets, including Bitcoin.
- Regulatory Uncertainty: While the US and EU have embraced ETFs, other regions may impose stricter rules.
- Liquidity Risks: Low liquidity periods could exaggerate price swings in either direction.
- Over-Leveraging: Excessive leverage in derivatives markets could cause sharp liquidations.
Expert Opinions & Market Sentiment
Several respected analysts are weighing in on Bitcoin’s next move:
- Michael Saylor (MicroStrategy): “Bitcoin remains the world’s premier digital asset. If we break $125,000, the next target could be $150,000 within months.”
- Katie Stockton (Fairlead Strategies): “The technical setup is bullish, but we need a confirmed weekly close above $98,500 to validate the breakout.”
- Arthur Hayes (BitMEX co-founder): “Volatility compression is a precursor to explosive moves. My bet is that the breakout will be upward, driven by ETF flows.”
Market sentiment indicators show a cautious optimism, with the Fear & Greed Index currently at 63 (Greed) — indicating traders are leaning bullish but aware of possible risks.
Future Outlook & Predictions
Here are three possible scenarios for Bitcoin in the next quarter:
- Bullish Scenario: A breakout above $125,000 attracts momentum traders, pushing BTC toward $125,000–$150,000 by year-end. ETF inflows and macro tailwinds support this move.
- Bearish Scenario: Rejection near $125,000 triggers a sell-off toward $104,500, shaking out over-leveraged positions before a potential recovery.
- Neutral Scenario: BTC continues to range between $92,000 and $100,000, frustrating traders but building a stronger base for a future rally.
Traders should watch for confirmed breakouts with strong volume before committing to positions.
Conclusion & Call-to-Action
Bitcoin is entering a make-or-break phase in 2025. Whether the price shatters the $100,000 barrier or retreats to test lower supports, the coming weeks will be pivotal for traders and long-term investors alike.
If you found this analysis helpful, share it with your trading community, bookmark it for future reference, and check our related articles on “” Dow Jones Industrial Average Rises Amid Key Support Test, Eyes Resistance Levels in August 2025 and “Top 50 Crypto Coins “
Disclaimer: This article is for informational purposes only and does not constitute financial advice. Always do your own research before making investment decisions.
Roobet’s Blackjack is pretty straightforward. If you’re into crypto gambling, it’s a decent option. Just remember to play responsibly! Check it out here: roobetblackjack
Da es sich um ein neues Online Casino handelt, gibt es noch wenige Nutzerbewertungen über die Plattform zu finden.
Dafür bietet das Casino im Nutzerkonto Optionen zur Festlegung
von Einsatzlimits sowie auf der Webseite einen Selbsteinschätzungstest an. Im
Anschluss haben wir die gängigsten Einzahlungsmethoden und ihre jeweiligen Limits für dich aufgeführt.
Diese können gegen Bonusguthaben oder Freispiele
eingetauscht werden. Das Bonusprogramm von X7 Casino online umfasst verschiedene Angebote für neue und
bestehende Spieler. Die Plattform bietet auch die Möglichkeit, sich über Social-Media-Konten anzumelden. Nach der Registrierung erhalten Spieler eine Bestätigungs-E-Mail.
X7 Casino operiert als vollständig lizenzierte Glücksspielplattform mit
Fokus auf Spielerschutz und verantwortungsvolles Spielen.
References:
https://online-spielhallen.de/888-casino-aktionscode-ihr-schlussel-zu-exklusiven-vorteilen/
Hey, just passing by to give dewabetvn8 a quick review. Dewabet is pretty reliable and dewabetvn8 is just another good option for getting some fun. Check em out dewabetvn8.
This casino pretends to be part of a famous brand, but it’s clearly not.
They mimic the real casino’s look, then swap the real link
with a mirror that points to a shady operator.
The site pretends to be a trusted brand, even copies
their bonus offers and design. If you are searching for
a new and exciting gaming experience that is specifically designed for Australians, you should give SkyCrown a try.
To get the bonus, you need to put at least A$20 in your account
for your first purchase.
With over 7,000 games and a fast 10-minute
payout time, Skycrown delivers top-notch entertainment for Aussies eager to
explore. Casino.guru is an independent source of information about online casinos
and online casino games, not controlled by any gambling operator.
A platform created to showcase all of our efforts aimed
at bringing the vision of a safer and more transparent online gambling industry to reality.
References:
https://blackcoin.co/online-casasino-welcome-bonuses-a-comprehensive-guide/
While the return-to-player rate sits at just 95% (according to slot software
provider Blueprint Gaming), there are nearly 5,000 ways
to win. It is a great place to play for those who like
having many weekly promos and jackpot slots available.
Allowing me to narrow my search by theme or by game
developer, for example, would be wonderful.
You can’t join an casino you come across only to find out it offers three deposit methods.
In the following lines, we will closely examine some of the most crucial components of every online casino.
All these are proven steps that will ensure you won’t get into trouble, and instead, you can enjoy quality casino games and poker.
For that purpose, we will present some of the crucial pros and cons of real money casino Australia.
This limitation significantly narrows down Aussie-friendly online casino options While online
gambling is restricted under the Interactive Gambling
Act 2001 and its 2017 Amendment, certain operators are
permitted to offer regulated betting services.
online blackjack paypal
References:
https://www.tokai-job.com
casino avec paypal
References:
https://jobsbotswana.info
gamble online with paypal
References:
https://suryapowereng.in/
gamble online with paypal
References:
https://www.refermee.com/companies/fast-payout-real-money-sites
Winer is not my favorite, honestly. Too many redirects and loading times. Not gonna lie, but you guys might like it! Check it here: winer
Hit88club isn’t bad. They have a good selection of games, and the bonuses are decent. Pretty standard stuff but solid gameplay. Check it out: hit88club
Had some fun on 15wincom last night. Won a few pesos! The site is pretty user-friendly, which is a plus. Give it a shot: 15wincom