
Introduction
Bitcoin (BTC) is once again approaching a crucial resistance level as bullish momentum builds on the daily chart. After bouncing from the $112,000 zone earlier this month, the leading cryptocurrency has been forming a steady upward trendline, signaling renewed buying pressure. With prices currently trading near $116,960 and the $120,000 level in sight, traders are closely watching for a breakout that could trigger the next significant rally. However, the looming resistance and mixed market signals suggest a breakout won’t come without a fight.
Bitcoin’s Ascending Trendline Signals Growing Bullish Momentum
Bitcoin’s recent recovery has been marked by a series of higher lows since early August, a classic sign of bullish market structure. The ascending trendline visible on the daily chart reflects consistent buying interest, with each dip being met with strong demand. This momentum has been supported by the 20-day simple moving average (SMA), which is acting as a dynamic support line.
The Bollinger Bands are narrowing compared to late July’s volatility, suggesting the market is entering a squeeze phase. Historically, such squeezes have preceded large price swings. The upper Bollinger Band currently aligns with the $121,175 level — a point that matches historical resistance from previous price rejections. This confluence makes $121K a critical level to watch for breakout traders.
Meanwhile, trading volumes have shown moderate but steady growth over the past week, indicating that participation is increasing as prices approach resistance. A decisive break above $120,091 could pave the way toward $124,000 and potentially $128,000 in the short term, but failure to breach this level might trigger a pullback toward the $115,000–$114,000 range.
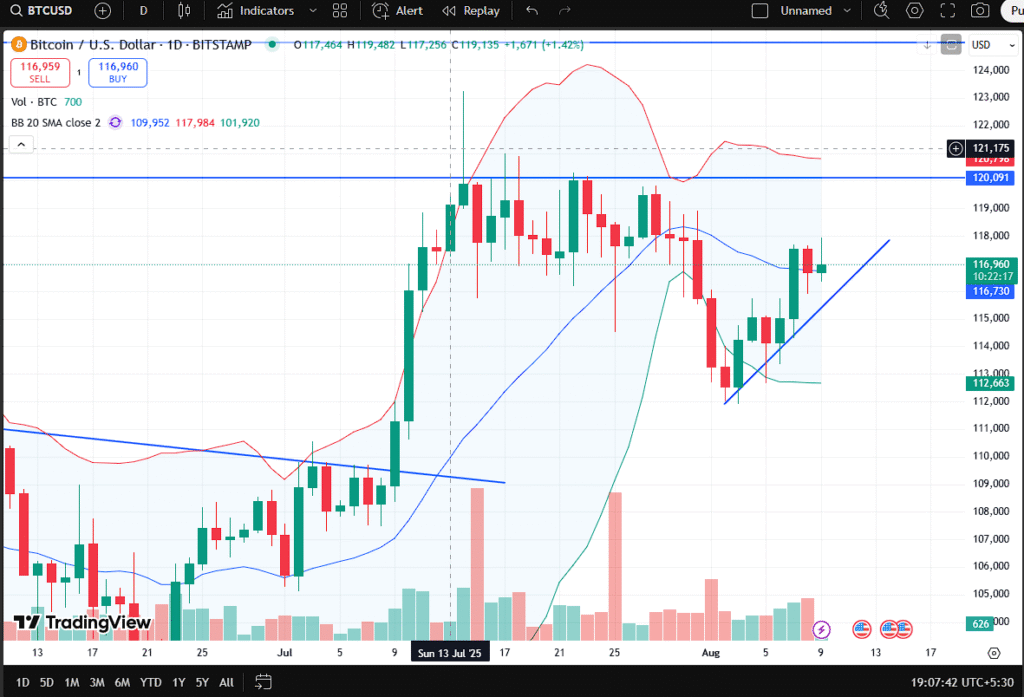
“Bitcoin daily chart showing ascending trendline and key resistance near $120K.”
Volume and Market Participation Show Strength
A deeper look at volume patterns reveals that buying pressure is becoming more consistent. The daily candles over the past five sessions have largely closed in the green, showing that bulls are gradually gaining control. While the volume spikes are not as dramatic as early July’s breakout from $110K, the steady accumulation pattern suggests that market participants are positioning ahead of a possible move.
Historical behavior around similar ascending trendline setups shows that Bitcoin often sees two scenarios:
- Breakout scenario: Price surges past the resistance with high volume, triggering a rapid move toward the next major psychological level.
- False breakout and retest: Price breaks above resistance briefly but quickly reverses, trapping late buyers and causing a sharp sell-off.
Currently, the Relative Strength Index (RSI) is hovering just below the overbought zone, around 62–64, indicating there is still room for further upward momentum before exhaustion sets in. Analysts are advising traders to watch for volume confirmation before taking large breakout positions.
A senior market strategist at CryptoInsights, Michael Tanner, commented:
“We’re seeing a healthy setup for Bitcoin, but it’s crucial to understand that resistance at $120K has held multiple times in the past. A true breakout requires a strong surge in buying volume — otherwise, we could see another pullback.”
Macro and Sentiment Factors Influencing Bitcoin’s Next Move
While technical charts suggest bullish momentum, macroeconomic factors could play a decisive role in whether Bitcoin can sustain a breakout. The broader crypto market has been recovering amid easing inflation fears in the U.S. and expectations that the Federal Reserve may hold interest rates steady in the coming quarter. This macro backdrop has historically been favorable for risk-on assets like Bitcoin.
In addition, institutional participation remains steady, with Bitcoin exchange-traded funds (ETFs) seeing modest inflows over the past two weeks. On-chain data also indicates a rise in wallet addresses holding between 10–100 BTC, suggesting that mid-sized investors are accumulating during the current consolidation.
However, potential headwinds remain. Regulatory discussions in the U.S. and Europe about stricter crypto compliance could dampen sentiment in the short term. Furthermore, if the U.S. dollar strengthens unexpectedly due to macro shocks, Bitcoin could face renewed selling pressure as traders shift toward safer assets.
This balance between bullish technical structure and uncertain macro developments is likely to define Bitcoin’s path over the next two weeks. Traders are being urged to remain flexible and use stop-loss strategies to manage risk during this potentially volatile phase.
$120K Resistance: The Gateway to Bitcoin’s Next Rally
The $120K level has emerged as one of the most significant price barriers for Bitcoin in recent months. Price action since late July has repeatedly tested this zone but failed to sustain a close above it. This resistance has psychological importance because it’s a round number and also aligns with previous high-volume nodes on the volume profile.
If Bitcoin breaks and closes above $120,091 with strong daily volume, it could open the door for a swift rally toward $124,000, followed by $128,500 — levels that correspond with prior swing highs. The measured move from the ascending triangle pattern also points toward a potential upside target in this range.
On the flip side, if Bitcoin fails to breach $120K and falls below the ascending trendline near $115,800, it could trigger a correction toward $114K or even $112,600. The latter is a key support level from earlier this month and coincides with the lower Bollinger Band, making it a critical point for bulls to defend.
Market watchers should also note that volatility tends to spike after such prolonged periods of consolidation. As a result, traders should be prepared for rapid price swings in either direction once Bitcoin tests this critical level.
Conclusion and Outlook
Bitcoin is approaching a make-or-break moment on the daily chart. The ascending trendline, narrowing Bollinger Bands, and growing trading volumes all hint at a possible breakout toward $120K and beyond. However, the market’s recent history at this resistance level reminds us that bullish setups can quickly turn into false breakouts without the necessary volume support.
For long-term investors, the current setup may offer a favorable entry point, provided they are prepared for short-term volatility. For traders, the key will be to watch for confirmation signals — including a daily close above $120,091 with strong volume — before committing to larger positions.
In the days ahead, macroeconomic news, institutional flows, and broader crypto market sentiment will likely shape whether Bitcoin breaks out or retreats for another consolidation phase.
Disclaimer: This article is for informational purposes only and does not constitute financial advice. Cryptocurrency investments are subject to high market risk, and past performance is not indicative of future results. Always conduct your own research before making investment decisions.
7ballcasino, yeah! It’s a pretty decent casino. Lots of games to choose from. Deposits and withdrawals are fast. Give it a try and see what you think 7ballcasino
Your point of view caught my eye and was very interesting. Thanks. I have a question for you.
Your article helped me a lot, is there any more related content? Thanks!
Werden drei oder mehr Tornado Scatter getroffen, so wird anschließend der Freispielbonus gestartet.
Ja, fast alle Slotspiele können auf den mobilen Geräten gespielt werden, beispielsweise auf iPhones,
Android-Smartphones, Tablets, etc. Um aber gewinnen zu können, müssen Sie zuerst
ein Kundenkonto bei dem betreffenden Casino anlegen und dabei Ihre persönlichen Daten bekanntgeben, eine Einzahlung durchführen (oder
einen Gratisbonus verwenden) und schließlich auch noch das notwendige Glück haben, um zu gewinnen.
Es ist wichtig, diese Optionen zu nutzen, wenn Sie das Gefühl
haben, dass es schwierig wird, das Glücksspiel zu kontrollieren. Daher
bieten Ressourcen, die den Grundsätzen des verantwortungsvollen Spielens folgen, Hilfsmittel
an, die den Spielern helfen, innerhalb vernünftiger Grenzen zu bleiben. Sonderaktionen bieten ein zusätzliches Element der Spannung und des Spielspaßes.
Dazu können Spielerturniere, Lotterien, Preisverlosungen (von Gadgets bis hin zu Reisen) und andere Veranstaltungen gehören, bei denen Sie zusätzliche Boni
oder Bargeld gewinnen können.
References:
https://online-spielhallen.de/gizbo-casino-auszahlung-alles-was-sie-wissen-mussen/
Heard 33winvvip’s got a good VIP program, if you’re into that sort of thing. High rollers might like it. Otherwise, standard online betting. Give it a go: 33winvvip
What makes 999,999,999,999,999,999,999 an interesting number from a
mathematical point of view? Just find the currency and get spelling for it.
By using this site you accept our terms and
conditions including our privacy and cookie, copyright and permissions
policies. Every whole number greater than 1 is formed from at least one prime
factor. Below you’ll find its key properties, along
with some statistical info, fun facts and trivia.
It has a total of two hundred fifty-six divisors. It is composed
of seven distinct prime numbers multiplied together.
References:
https://blackcoin.co/fair-go-casino-login-guide/
It is the player’s sole responsibility to inquire about the existing laws and regulations
of the given jurisdiction regarding age limitations for online gambling.
It is the player’s sole responsibility to inquire about the
existing laws and regulations of the given jurisdiction for online gambling.
Featuring a diverse selection of games, including slots, live casino, table games, and more, Casino Rocket combines a sleek design with smooth
functionality. We prioritise urgent matters like login rocket
casino problems or security concerns.
With secure payment options, exciting promotions, and top-notch
customer service, we ensure that your gaming experience
is seamless and enjoyable. You can easily play all games at the
website on your browser without downloading. There is a good collection of live dealer games such as roulette, blackjack and baccarat at Rocket Casino.
Yes, you can play most pokies and some table games free of charge.
Be sure to check for any current casino bonus codes 2025 to maximize your initial deposit
benefits, typically covering your first two deposits.
Your gaming experience here is guaranteed to be safe and fair, ensuring you never encounter
a “page not found” feeling when it comes to
security within the casino industry. We believe that banking should be as enjoyable and stress-free as playing your
favorite games.
References:
https://blackcoin.co/cocoa-casino-review/
online casino mit paypal
References:
unidemics.com
paypal casinos online that accept
References:
https://tankra.store
casino avec paypal
References:
https://lookingforjob.co/profile/mallorythomson
online casino paypal
References:
https://jobs.cntertech.com/employer/best-online-casino-australia-2025-real-money-casino-guide/
**mitolyn official**
Mitolyn is a carefully developed, plant-based formula created to help support metabolic efficiency and encourage healthy, lasting weight management.
Your article helped me a lot, is there any more related content? Thanks!
Can you be more specific about the content of your article? After reading it, I still have some doubts. Hope you can help me.
Your article helped me a lot, is there any more related content? Thanks!
Can you be more specific about the content of your article? After reading it, I still have some doubts. Hope you can help me.
I don’t think the title of your article matches the content lol. Just kidding, mainly because I had some doubts after reading the article. https://accounts.binance.bh/register/person?ref=IXBIAFVY