
Bitcoin (BTC/USD) is making headlines again as it breaks out above a multi-week resistance zone, closing at $121,652 on July 14, 2025, up by 2.11%. The breakout is accompanied by increasing volume and strong momentum, suggesting a potential rally toward the psychologically significant $125,000 level.
In this detailed technical analysis, we examine BTC’s latest price action using Bollinger Bands, trendlines, volume data, and candlestick behavior. This analysis will help traders and investors identify the key levels and strategic insights for the upcoming sessions.
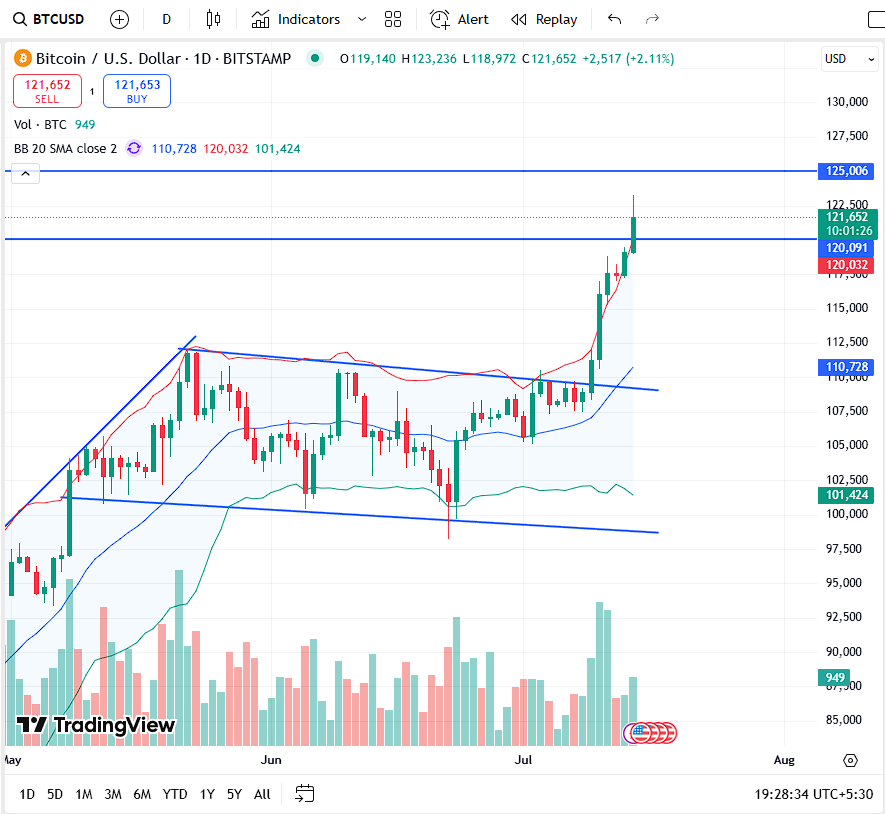
📊 Market Snapshot (as of July 14, 2025):
- Open: $119,140
- High: $123,236
- Low: $118,972
- Close: $121,652
- Change: +$2,517 (+2.11%)
- Volume: 949 BTC
Bitcoin posted a bullish engulfing candle with higher highs and higher lows—suggesting strong buyer control.
🔍 Technical Breakdown:
1. Bollinger Bands (BB 20, SMA Close 2): Breakout Confirmation
- Upper Band: $120,032
- Middle Band (20 SMA): $110,728
- Lower Band: $101,424
The price has decisively broken above the upper Bollinger Band, confirming a strong momentum breakout. This type of move generally suggests overbought strength, often leading to momentum continuation rallies before eventual mean reversion.
2. Chart Pattern Analysis: Falling Wedge Breakout
Between May and early July, Bitcoin was consolidating inside a falling wedge pattern, a bullish reversal setup. The recent breakout above the $110,000 zone confirms the pattern breakout, with the price surging straight through minor resistances.
The wedge target based on the height of the pattern (~$15,000 move) gives us a measured target of around $125,000 to $126,000, which aligns with the next visible horizontal resistance.
3. Support & Resistance Levels:
🟢 Immediate Support:
- $120,091 – Previous horizontal resistance, now acting as support
- $110,728 – 20-day SMA and wedge breakout level
- $101,424 – Lower Bollinger Band support
🔵 Key Resistance Levels:
- $122,500 – Minor consolidation barrier (tested intraday)
- $125,006 – Strong horizontal resistance zone
🎯 Breakout Target:
- $126,000 – Derived from wedge height and Fibonacci projections
4. Volume Analysis: Bullish Accumulation
The recent rally is backed by increasing volume over the past 7–10 sessions. The highest green volume bars are seen post-breakout, confirming that institutional and large-cap investors are participating in the rally.
Such volume-supported breakouts tend to be more sustainable, unlike false breakouts with weak participation.
5. Candlestick Confirmation:
The daily candle on July 14 is a strong bullish continuation candle, confirming market strength and follow-through buying.
Previously, a series of bullish candles around $110,000–$115,000 hinted at accumulation. Now with the breakout above $120,000, a bullish trend continuation is underway.
📈 Trend Outlook:
- Short-Term Trend: Bullish
- Medium-Term Trend: Strongly Bullish
- Volatility: Expanding (positive breakout beyond BB upper band)
🔮 Predictions & Strategic Levels for the Week:
| Type | Price Level | Commentary |
|---|---|---|
| 📉 Support 1 | $120,091 | Recent breakout level |
| 📉 Support 2 | $110,728 | 20-day SMA, wedge top |
| 📈 Resistance 1 | $122,500 | Minor hurdle |
| 🎯 Target Zone | $125,006–126,000 | Main bullish target from breakout |
💼 Strategy for Traders:
📌 For Swing Traders:
- Buy on dips near $120,000 with SL below $118,000.
- Target: $125,000–126,000
- Risk-reward ratio: Favorable (1:2+)
🧠 For Cautious Investors:
- Partial booking recommended if already in profit.
- Wait for a pullback near $115,000–118,000 for fresh accumulation.
- Use trailing stop-loss strategy to protect gains.
📉 For Short Sellers:
- Avoid aggressive shorting unless price reverses below $120,000 with high volume.
- Bearish signals will only confirm below $118,000.
🌐 Global Crypto Sentiment:
- ETF Approvals: Positive momentum from institutional inflows
- Macro Factors: Inflation slowdown in US supporting risk-on trades
- Altcoins: Following BTC breakout with lag, indicating dominance shift
Bitcoin is currently leading the crypto market recovery with decisive strength.
📌 Summary:
Bitcoin has decisively broken above key resistance levels with strong volume and momentum. The breakout from the falling wedge pattern and close above $120,000 mark the beginning of a potential new leg of the bull run, with $125,000–$126,000 in sight.
Unless there’s an unexpected reversal below $118,000, bulls seem to be in full control of the market. Traders and investors should continue riding the trend, with proper risk management.
📢 Standard Disclaimer:
The information presented in this article is for educational and informational purposes only. It should not be construed as financial or investment advice. Cryptocurrency investments are subject to high market risks, and price volatility can result in significant losses. Always consult with a certified financial advisor before making any investment decisions. The author and the website are not liable for any losses incurred.
Yo, just checked out du88bet, looks pretty slick! Gotta admit, the games are fire and the site’s easy to navigate. Might just become my new go-to. Check it out yourself! du88bet
Yo, wanted to chime in about 66win9. This site is decent. They have a good variety of games, and navigation isn’t too bad either. Bonus structure isn’t the best, but it is functional. Worth a check on your own accord 66win9.
Downloaded the 888slotapk. Seems pretty smooth so far. Gonna test out the jackpot slots later. Wish me luck!
cc6ph4 is my new go-to. Easy to navigate and got some fun new games I haven’t seen anywhere else.
Looking for a good sportsbook? cmd368casino has a wide range of sports to bet on! Just started using their site and liking it so far!
Your article helped me a lot, is there any more related content? Thanks! https://www.binance.info/register?ref=IHJUI7TF
Thanks for sharing. I read many of your blog posts, cool, your blog is very good. https://www.binance.com/register?ref=IHJUI7TF
I don’t think the title of your article matches the content lol. Just kidding, mainly because I had some doubts after reading the article.