

Bitcoin (BTC/USD) is trading in a tight consolidation zone below the critical $110,000 mark. The price action is compressing within a symmetrical triangle pattern on the daily chart, hinting that a major breakout could be imminent. After a sharp rally in April-May, BTC is now navigating sideways movement, while bulls and bears await a decisive move.
Price Snapshot :
- Current Price: $108,674 (Down 0.25%)
- Day’s Range: $108,352 – $109,777
- Resistance Zone: $111,500 – $112,012
- Support Levels: $106,908 and $102,297 (Bollinger Band basis)
Chart Pattern Analysis:
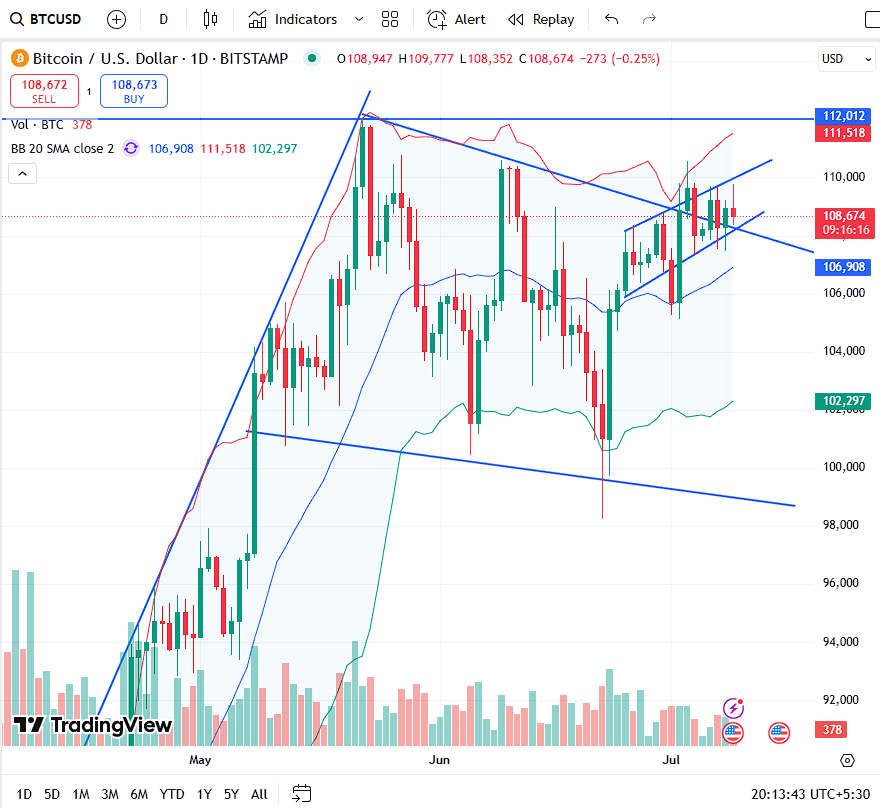
- Symmetrical Triangle Forming:
Bitcoin is clearly forming a triangle pattern with converging trendlines. This pattern typically leads to a breakout or breakdown, depending on volume confirmation and macro sentiment. - Previous Uptrend Pause:
After a strong vertical move in April-May (visible with steep ascending support), Bitcoin peaked near $112,000 and has been trading sideways since. Price compression suggests that volatility may spike soon. - Failed Breakout Attempts:
BTC has made several failed attempts to close above the upper triangle trendline and Bollinger Band resistance (~$111,518), reinforcing the importance of that level.
Bollinger Bands and Moving Averages:
| Indicator | Value (Approx.) |
|---|---|
| Upper Bollinger Band | $111,518 |
| Midline (SMA 20) | $106,908 |
| Lower Bollinger Band | $102,297 |
- The price is currently trading between the middle and upper bands, indicating moderate bullish bias, but not a breakout yet.
Volume Analysis:
- The volume bar has been declining as the triangle narrows, which is typical before a breakout.
- Watch for a volume spike on the day BTC breaks above $111,500 or falls below $106,000.
Key Levels to Watch:
Immediate Resistance:
- $111,500–$112,012: Major horizontal and triangle resistance.
- Break above this could trigger a rally toward $115,000 – $117,500 levels.
Critical Support:
- $106,900 (SMA): First bounce zone.
- $102,300 (Lower Band): Final line of support before a breakdown to $98,000–$100,000 zone.
What Traders Should Do Now
Bullish Strategy:
- Watch for breakout above $112,000 on high volume.
- Long positions can be initiated with targets of $115K, $117.5K, and extended to $120K.
- Maintain stop-loss at $106,900 for safety.
Bearish Strategy:
- Breakdown below $106,900 may drag BTC toward $102K or even $98K.
- Short entries possible on confirmation with strong red candle and volume spike.
Conclusion: BTC at a Pivotal Point
Bitcoin’s price is currently coiling within a well-defined triangle pattern after a strong rally. The next 2–3 daily candles could determine the direction of the next major move. A bullish breakout could reignite momentum toward $120K, while a failure may lead to a deeper correction.
⚠️ Disclaimer:
The information presented is for educational purposes only and should not be considered financial advice. Please conduct your own research or consult a financial advisor before making investment decisions.


Thank you for your sharing. I am worried that I lack creative ideas. It is your article that makes me full of hope. Thank you. But, I have a question, can you help me?
VerdeCasino Games bietet wettbewerbsfähige Quoten und eine benutzerfreundliche Oberfläche,
um ein spannendes und vielseitiges Sportwetten-Erlebnis zu ermöglichen. Neben dem beeindruckenden Casino-Angebot bietet VerdeCasino Games
eine erstklassige Sportwetten-Plattform mit einer Vielzahl an Wettmöglichkeiten. Diese abwechslungsreichen Spielekategorien machen Verde Casino zu einer
der vielseitigsten Plattformen für Online-Glücksspiel in Deutschland.
Diese und viele weitere Live-Dealer-Spiele wie Baccarat, Mega Wheel und Monopoly Live
bieten eine erstklassige Unterhaltung, die das Flair eines echten Casinos
direkt auf den Bildschirm bringt.
Marke bietet eine Fülle von Vorteilen für Nutzer aus Deutschland.
Verde Casino ist eine moderne Glücksspiel- und Wett-Webseite, die
in Deutschland tätig ist. Die Verde Casino Registrierung ist ein vergleichsweise einfacher Prozess, der zügig von der Hand geht.
Holen Sie sich deshalb am besten noch heute den kostenlosen Registrierungsbonus.
Bis zu 25 Euro kann man am Ende in Echtgeld umwandeln und auszahlen lassen, wenn man möchte.
Lesen Sie einfach weiter, um alles zu erfahren.
References:
https://online-spielhallen.de/spirit-casino-freispiele-dein-weg-zu-kostenlosem-spielspas-und-echten-gewinnen/
888casino ist eine der beliebtesten Online-Glücksspielplattformen der Welt.
Spieler in Österreich können exklusive Boni und sichere Zahlungsoptionen genießen. Zum
Beispiel können Spieler, die versuchen, sich von Gebieten aus anzumelden, in denen Online-Glücksspiele verboten sind,
Probleme bei der Anmeldung bekommen. Dies
trägt dazu bei, eine sichere Umgebung für alle Benutzer zu
schaffen, damit sie ihr Spielerlebnis ohne Sorgen genießen können. Für zusätzliche Sicherheit bietet die Anmeldung
bei 888casino.com eine Zwei-Faktor-Authentifizierung.
VIP-Mitglieder genießen einen persönlichen Service, höhere Auszahlungslimits und spezielle Angebote wie 888 Casino Freispiele
für bestehende Kunden. Es wurde 1997 gegründet und bietet eine breite Palette von Spieloptionen, darunter
Slots, Tischspiele und Live-Dealer-Spiele. 888casino ist eines der führenden Online-Casinos, das für seine Vielfalt an Spielen und seine sichere, benutzerfreundliche Plattform bekannt
ist.
Unser Ziel ist es, ein verantwortungsbewusstes Spielumfeld
zu fördern, in dem du sicher und informiert wetten kannst.
Diese Systeme helfen dabei, problematisches Spielverhalten frühzeitig zu erkennen und entsprechende Maßnahmen zu ergreifen. Diese Lizenz gewährleistet, dass wir alle gesetzlichen Anforderungen einhalten und einen fairen und transparenten Wettbetrieb anbieten.
Ein guter Ort für Online Slots ist immer ein Merkur Online Casino oder
ein Novoline Online Casino, die mit vielen Automatenspielen aus lokalen Spielotheken ausgestattet sind.
Natürlich gibt es dort auch Roulette und Blackjack, aber diese Klassiker spielen hier eine eher untergeordnete Rolle.
Mehr Details zu den Casinospielen sowie den aktuellen Pokerturnierplan findet ihr
im Test der Spielbank Hohensyburg. Generell müsst ihr mindestens 18 Jahre alt sein, um in diesen Casinos
spielen zu können. Ein Casino ist eine Spielstätte, in der
Glücksspiele um Echtgeld stattfinden.
Punto Banco (Baccara) war lange nur in Stuttgart und Dortmund verfügbar, inzwischen bieten auch die bayerischen Casinos in Bad Füssing, Garmisch-Partenkirchen und Feuchtwangen dieses
Spiel an. Leser finden hier die neuesten Casino News und Nachrichten zu Themen rund um lokale Spielbanken, virtuelle Spielhallen und vieles mehr.
Die folgende Übersicht zeigt, welche staatlichen Spielbanken in den einzelnen Bundesländern zu finden sind und gibt einen Überblick über die regionale Verteilung sowie das jeweilige
Spielangebot. Während die Gemeinsame Glücksspielbehörde der Länder (GGL) ausschließlich für die Regulierung von Online Glücksspiel zuständig ist,
unterliegen staatliche Casinos in Deutschland der Gesetzgebung
der einzelnen Bundesländer.
References:
https://online-spielhallen.de/der-frumzi-casino-aktionscode-ihr-schlussel-zu-exklusiven-vorteilen/
Many Australian players prefer to evaluate a casino’s payout structure before joining, which is a smart move.
In contrast, games like blackjack and roulette offer more
reliable payouts and are less unpredictable.
To prevent this, we strive to recommend casinos that
boast extensive game libraries. The design and development of casinos
significantly influences the overall staking experience.
A question frequently posted to our experts is, “Which is the leading online casino?
The significance of bonuses and promotions should never be downplayed when seeking the best online casinos, particularly during the journey through Stakers. Yes, online casinos pay real money that you can withdraw using different payment options, such as credit cards, bank transfers, e-wallets, etc. The recent development in real money online casinos has made choosing software developers crucial. In summary, our curated selection of the finest online casinos in Australia offers an exceptional range of gaming options, including the much-loved pokies.
FanDuel offers a plethora of real money casino games and slots, regular competitive bonuses, plus a leading gaming user experience. Welcome bonuses are a staple of Australian online casinos, designed to attract new players by offering substantial rewards upon signing up and making their first deposit. The good news is that most (if not all) online casinos offer free-play options alongside their real-money games. Many online casinos that do pay out real money, also have an option that lets newbies try their luck at all of their games, without needing to make a deposit. All of these games can be played for real money at the numerous online casinos available online right now. Most Australian-friendly online casinos require registration to play real money games.
References:
https://blackcoin.co/57_instant-play-casinos-2022_rewrite_1/
We are a whole team working together to bring you updated picks
of the best Australian online casinos based on their safety, payout history, software partners, and more.
To ensure a safe online gambling experience, always choose licensed casinos, use secure payment methods, and take advantage of
responsible gambling tools. The best online casinos in Australia for 2025
include Neospin, Dundeeslots, 1Red Casino, Queenspins, and others.
The IGA prohibits online gambling companies from offering their services to Australian players.
Reading reviews helps potential players make informed
choices, ensuring the selection of a trustworthy and enjoyable online casino.
The casino embraces the future of gaming with open arms, offering features that redefine what it means to play online.
The extensive library of games is a testament to the casino’s majesty, offering subjects
a vast realm of slots and table games to conquer. Beyond roulette, the casino offers a gamut of gaming delights,
ensuring that players with every kind of taste
find their niche. The casino’s commitment to fast payouts is not just a courtesy; it’s
a cornerstone of the NeoSpin gaming experience, a testament to the respect it holds for its players’
time and trust. Among the plethora of online casino sites,
a select few stand out in the Australian online gambling sites landscape.
Use this to test games before playing with real money.
If you win $300 and meet the wagering requirements, you can withdraw $200 (your
winnings minus the $100 bonus). They usually come with higher wagering requirements and minimum deposit thresholds.
For example, a 30x requirement means you need to
wager your bonus thirty times over before cashing
out.
Online casinos offer massive table limits that accommodate any betting strategies and systems.
Online Roulette is one of the world’s most famous table games, offering a variety of betting options and generous payouts.
Whether you’re new or an experienced gambler, knowing
the types of games and the best titles in each category is a clear advantage.
Loyalty rewards aim to keep you coming back and make more deposits
by offering additional perks, bonus offers, and benefits you can’t get anywhere else.
From thousands of real money pokies to a huge live casino section with blackjack,
roulette, baccarat, and poker tournaments, this site is packed with choice.
To see a direct comparison, watch our review of the top Australian online casinos in 2025.
There is no limit to how much you can win at new online casinos, but there is a limit to how
much you can cash out, usually in the range of A$10,000 to
A$20,000, or even more, monthly. New Australian online
casinos can facilitate payments through Visa and MasterCard credit and debit cards,
e-wallets like MiFinity, and cryptocurrencies like
Bitcoin, Dogecoin, Ethereum, Litecoin, Binance Pay, Cardano,
etc.
It’s widely available at Australian banks and offers enhanced security by
not sharing your banking details with the casino.
This method is preferred by players who prioritise security over transaction speed.
These options make depositing funds and playing on your preferred site possible.
Choosing games with high RTP percentages is a smart strategy for maximising your chances of winning.
A game with 98% RTP offers better long-term prospects than one with 92% RTP.
In Keno, players choose numbers and hope they match those drawn randomly.
References:
https://blackcoin.co/pokiesurf-a-quick-overview/
Also, fairgocasino.com.au’s customers’ contentment is taken into consideration when creating their
games. Jackpot Hunter by Pragmatic Play takes players on an adventure reminiscent
of Indiana Jones in search of riches. Exciting news
awaits players at Fair Go Casino with the availability of
a No Deposit Bonus offer! There’s no doubt that Fair Go Casino is a decent gambling
site for Australian players. The casino offers 24/7
customer support services through the live chat feature, email
address, and phone calls. Now, let’s say you’ve found
a new slot game at the casino and you are
reluctant to place real money bets.
Therefore, players must fund their accounts to be eligible.
This offer is exclusively for new Australian casino players and
is subject to a 60x wagering requirement. Fair Go Casino is rolling out the red carpet for new Australian players with an exclusive $5 free chip—no deposit required!
As you play real money games and accumulate points,
you’ll be invited to join this prestigious club. Our platform
is distinguished by a steadfast commitment to player security, fair gaming practices,
and a superior user experience.
References:
https://blackcoin.co/2_top-5-high-roller-online-casinos_rewrite_1/
To learn more about provably fair games, visit this page. All games are regulated under the license
of Curacao. For example, bitstamp, coinbase, and spice play.
7Bit experts always cross-check the quality of mobile gameplay before adding games to our top slots roster.
We sort the best online slots to play based on our 7Bit
casino statistics. Try your luck in our top slots using
cryptocurrencies at our Bitcoin online casino. Our experts have shortlisted the
best online slots for real money play. This is because
our live dealer bitcoin casino is available on your mobile device.
You may play slots, table, and card games in free demo versions.
Gamblers with their own strategies maximize
their victorious chances to win a Bitcoin casino jackpot.
A diverse range of themes will mesmerize even the pickiest gamers.
Our Bitcoin limits are a minimum of 1Mbtc bet estimate and a maximum of
400Mbtc bet estimate. All you need is good internet and accessibility online.
Also, a live croupier is controlling the wheel, cards, and
table without any automation or robotic system. We operate under the laws of Curacao.
References:
https://blackcoin.co/the-best-australian-mobile-casinos-2025/
Cucumber ribbon, cherry tomato, feta cheese, pickled
red onion, mesclun lettuce, ranch dressing Our facilities are
world-class, as is our catering and breathtaking beachfront location…no wonder
our venues are popular with function and event organisers worldwide.
Mindil Beach Casino Resort is the premium
business and events destination in the Top End and features Darwin’s only five-star resort and
four-star hotel. Relax and enjoy appetizers that are perfect for
sharing, award-winning cocktails (or maybe a top-shelf whisky), and listen to live tunes
from NT’s most talented musicians. Sandbar is the place to be for after-work drinks or simple, relaxed dining with friends.
Radicchio, endive, rocket, baby spinach, frisee, artichoke, cucumber, cherry tomato, red capsicum, onion, olives,
almonds, broccoli, balsamic dressing Grilled chicken breast, cucumber, cherry tomato, red capsicum, onion, olives, rocket, radicchio, endive, frisee, baby spinach,
pesto dressing Grilled prawns, crunchy pancetta, crispy bread, tomato, cucumber,
red onion, red capsicum, basil, balsamic dressing
References:
https://blackcoin.co/wild-casino-review-safety-games-more/
paypal casinos online that accept
References:
http://www.jobteck.co.in
gamble online with paypal
References:
gramshort.com
paypal casino
References:
http://vv4bi6jvuj.kr
online casino with paypal
References:
https://bhakticonsultaants.com/employer/our-favorite-paypal-casinos-2025-ranking-update/
Your article helped me a lot, is there any more related content? Thanks!
online casino with paypal
References:
https://stayzada.com/bbs/board.php?bo_table=free&wr_id=551079
australian online casinos that accept paypal
References:
http://bukgu.net/bbs/board.php?bo_table=free&wr_id=3486
online casino accepts paypal us
References:
https://dreamyourjobs.com/employer/2025/
Thank you for your sharing. I am worried that I lack creative ideas. It is your article that makes me full of hope. Thank you. But, I have a question, can you help me? https://www.binance.info/en-NG/register?ref=YY80CKRN
Thank you for your sharing. I am worried that I lack creative ideas. It is your article that makes me full of hope. Thank you. But, I have a question, can you help me?
Can you be more specific about the content of your article? After reading it, I still have some doubts. Hope you can help me.