
1. Current Price Structure
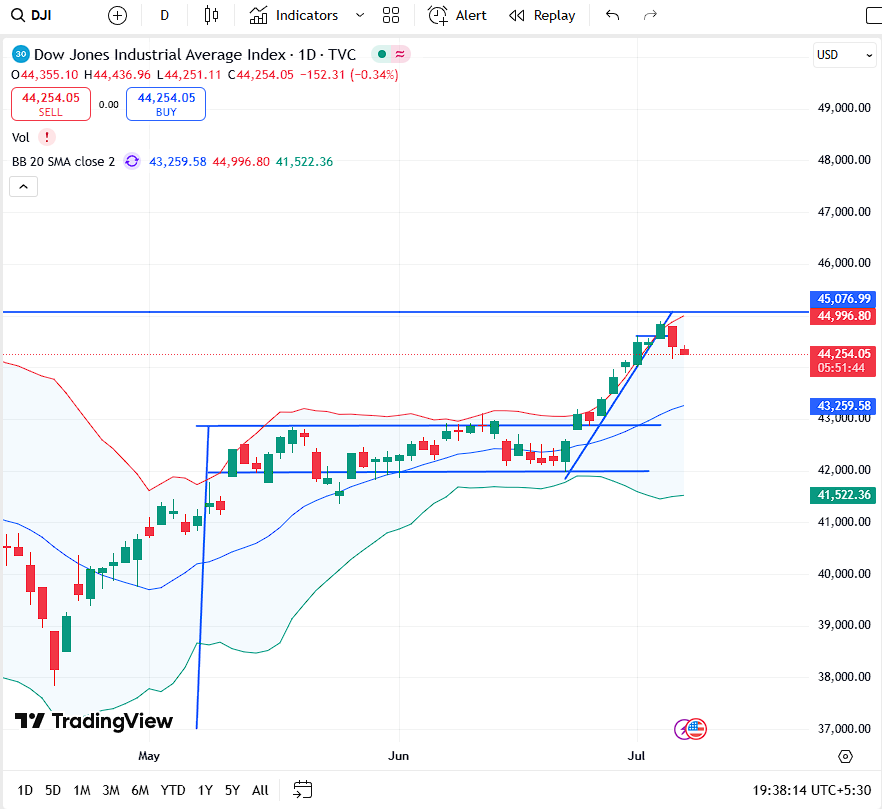
- Current Price: 44,254.05
- Day’s Range: 44,251.11 – 44,436.96
- Change: -152.31 points (-0.34%)
- Previous High Resistance: 45,076.99
- Bollinger Band Midline (20 SMA): 43,259.58
- Support Zone: 43,200 – 43,500
- Breakout Base: ~42,000
2. Trend Analysis
✅ Uptrend Intact but Weakening
- The Dow Jones has seen a strong vertical rally from the ~42,000 zone starting mid-June.
- The price had recently broken above a horizontal resistance (marked at 44,996.80 / 45,077), confirming a breakout pattern, but now:
- It has failed to sustain above this level.
- Two consecutive red candles have formed, indicating profit booking or distribution near psychological resistance.
3. Candlestick & Volume Analysis
- Today’s red candle has a long upper wick, which suggests supply pressure from higher levels.
- The last green candles were on relatively decreasing volume, which indicates buyers were losing strength as the index approached the resistance.
- Lack of a bullish follow-through is a warning sign of a potential reversal or short-term correction.
4. Bollinger Band Analysis
- Price was hugging the upper Bollinger Band, which is typical in strong uptrends.
- Now it has pulled back sharply toward the median band.
- If the index breaks below the Bollinger midline (43,259), the momentum would shift toward mean reversion or deeper correction.
5. Support & Resistance Levels
| Level | Significance |
|---|---|
| 45,076 | Immediate resistance (rejection zone) |
| 44,996 | Psychological resistance |
| 44,254 (current) | Current price support, must hold |
| 43,259 | 20-SMA, trend strength line |
| 42,000 | Breakout base and major support |
| 41,522 | Lower Bollinger Band (oversold support zone) |
6. Pattern Formation
📉 Possible Bearish Reversal (Short-term)
- The index is forming a double top or bull trap setup near 45,000.
- Failure to close above 45,077 twice and rejection candles suggest momentum exhaustion.
- A break below 43,200–43,000 would confirm a short-term bearish breakdown with targets toward 42,000 or even 41,500.
7. Indicators (Implied)
- RSI (not shown): Likely in overbought zone and may now be turning downward.
- MACD: May be showing early divergence; crossover watch necessary.
- Momentum is cooling off after a sharp vertical run — suggesting possible sideways or corrective price action.
8. Global Sentiment Impact
🌐 On Nifty 50 and Global Markets:
- Dow Jones’s struggle to sustain above 45,000 could act as a sentiment drag on Asian markets like Nifty 50.
- If Dow corrects toward 43,000, Nifty may revisit 25,200–25,000 before resuming upside.
- Conversely, a bounce from 43,200–43,500 in DJI would support bullish continuation in Nifty.
9. Strategic Outlook
🎯 Bullish Case
- DJI must close above 45,000 on strong volume.
- Target: 46,000–46,500
- Stop-loss: Below 43,000 (for medium-term positions)
⚠️ Neutral Case
- Range-bound between 43,200 and 45,000
- Wait for breakout/breakdown confirmation
🔻 Bearish Case
- Breakdown below 43,200 → Possible retest of 42,000 → 41,500
- This would align with global risk-off and FII selling
10. Conclusion
The Dow Jones Industrial Average is at a critical juncture. After a steep upmove and breakout above previous highs, the index is now facing resistance near 45,000. If bulls fail to defend current levels, a pullback to 43,000–42,000 is highly probable.
vqwyk7
Your point of view caught my eye and was very interesting. Thanks. I have a question for you. https://accounts.binance.com/en/register?ref=JHQQKNKN
Der Film überzeugt durch seine stimmige Balance aus dramatischen Momenten und leichten, humorvollen Dialogen, die den Zuschauer in den Bann ziehen. Aufgrund
seiner Suche nach Rache, meldet er sich schlussendlich beim MI6 zurück, macht Mr.
White ausfindig und tötet in dann aus Rache auf seinem Anwesen. Bei diesem Kampf starb
allerdings seine Geliebte, wodurch er sich nach Rache sehnte, obwohl er selbst
gar nicht wusste, ob er von ihr ausgenutzt
wurde oder ob sie ihn wirklich geliebt hat.
Gerade bei letzteren beiden geschah dies genauso im bewussten Kontrast zu den extrem überzogenen Vorgängern Man lebt nur
zweimal und dem Science-Fiction-haften Moonraker. Bond kann die
bewaffneten Hintermänner ausschalten, doch Vesper entschuldigt sich bei Bond und schließt sich in einen vergitterten Fahrstuhl ein, der mitsamt dem Haus im Canal Grande versinkt.
Das Preisgeld transferiert Bond auf ein Konto, das Vesper ihm angibt.
Zudem ist Clemens Schick als Le Chiffres Handlanger Kratt zu sehen. Auch seine fehlende Erfahrung in Hochglanzproduktionen wurde ihm vorgehalten, war er zuvor doch vorwiegend in intimeren Dramen zu sehen. Martin Campbell wurde
nach Pierce Brosnans erfolgreichem GoldenEye zum zweiten Mal mit der Einführung eines neuen Bonds betraut,
wie im Februar 2005 zusammen mit dem Filmtitel bekanntgegeben wurde.
Letztlich wollten beide Seiten einem Glaubwürdigkeitsverlust
zuvorkommen, wie ihn der damals 58-jährige Roger Moore zum Ende seiner Zeit als James Bond hinnehmen musste.
References:
https://online-spielhallen.de/greatwin-casino-cashback-ihr-weg-zu-besseren-gewinnen/
Von einsteigerfreundlichen Spielautomaten bis hin zu Blackjack-Tischen mit hohen Einsätzen hat
888casino alles zu bieten. Wenn Sie auf der Suche nach einem seriösen Online-Casino sind, das sowohl Spaß als auch Sicherheit bietet, dann
ist 888casino eine gute Adresse für Sie. Die Plattform ist bekannt für ihre sichere Umgebung, ihr
benutzerfreundliches Design und ihre vielfältige Auswahl an Spielen, darunter Slots, Tischspiele und Live-Casino-Optionen. 888casino ist eines der
führenden Online-Casinos, das Spielern auf der ganzen Welt eine breite Palette an spannenden Spielen bietet.
Es bietet eine breite Palette von spannenden Spielen, darunter Slots, Tischspiele und Live-Casino-Optionen. Glücksspiel kann süchtig machen, bitte spielen Sie verantwortungsbewusst.
Die besten Wettanbieter bieten zudem umfassende Statistiken und Sportwetten Prognosen, die dir helfen, fundierte Entscheidungen zu treffen. Das
erhöht nicht nur die Spannung, sondern bietet auch
zahlreiche Chancen, auf sich ändernde Spielverläufe zu wetten und damit deine Gewinnmöglichkeiten zu maximieren.
Lade die Sportwetten App herunter und erlebe, wie einfach und flexibel Wetten sein können!
Saisonwetten, bei denen du auf den Weltmeister tippst, bieten zusätzliche
Spannung über die gesamte Rennsaison hinweg. Die Welt der Sportwetten ist vielfältig
und bietet dir die Möglichkeit, deine Begeisterung für verschiedenste Sportarten in spannende Wettmöglichkeiten zu verwandeln.
Bei 888Sport.de legen wir größten Wert darauf, eine
sichere und vertrauenswürdige Umgebung für unsere Nutzer zu schaffen. Erlebe die Spannung und den Nervenkitzel von Live-Sportwetten und fühle dich
wie ein Teil des Spiels. Mit unseren Sportwetten Vorhersagen und Live-Ergebnissen bleibst du immer auf dem Laufenden und kannst deine Wetten optimal platzieren. Das macht jedes Spiel noch packender
und bietet dir unzählige Wettmöglichkeiten. Du kannst
auf verschiedenste Ereignisse wetten, wie das nächste Tor, die nächste Ecke oder sogar den nächsten Einwurf.
Sportwetten und insbesondere Live-Wetten bringen dich
mitten ins Herz der Action.
References:
https://online-spielhallen.de/lex-casino-mobile-app-dein-spielvergnugen-fur-unterwegs/
Die Spielauswahl umfasst Angebote von führenden Anbietern wie NetEnt, Microgaming, Pragmatic
Play und Evolution Gaming. Das Fat Pirate Casino Online, das Spielern eine
spannende Spielerfahrung mit der Piraten-Themen-Oberfläche, der großen Spielauswahl und den großzügigen Boni bietet, die auch auf Mobiltelefonen genossen werden können. Deutsche Spieler bei Fat Pirate DE können den Kundensupport-Service
rund um die Uhr per Live-Chat und E-Mail kontaktieren.
Das Treueprogramm mit mehreren Stufen bietet Privilegien, darunter erhöhte Auszahlungslimits, persönlichen Service und Cashback.
Fat Pirate Casino bietet eine große Auswahl an Spielen von bekannten Anbietern, Bonusangebote und ein durchdachtes Treueprogramm.
Fat Pirate versteht das und bietet eine hochwertige mobile Version der Website.
References:
https://online-spielhallen.de/verdecasino-freispiele-dein-weg-zu-kostenlosen-gewinnen/
Deposit casino bonuses are offers for new or existing players, as a reward for making a real money casino deposit.
As this is a no deposit bonus, claiming it does not
require players to deposit money into their casino account.
Eligible new players that create an account at Gonzo Casino can claim a
no deposit casino bonus that consists of 123
free spins. There is no doubt that casino bonuses are extremely
popular in the world of online casinos. Not many online casinos offer deposit options that low.
Below, you can read about no deposit bonuses for new players offered by Gonzo Casino.
Welcome casino bonuses include no deposit bonuses, deposit bonuses, and more.
We advise to consider the casino’s Safety Index before creating an account and/or claiming any bonuses.
There are many different types of casino bonuses, which
include welcome bonuses, deposit bonuses, no deposit bonuses, free spins, promo codes, and much more.
Keep reading to learn more about casino bonuses available to new or existing players at Gonzo Casino.
We feel you, players, as we’re mostly used to an abundance of great
bonuses that keep your interest high enough to continue investing your funds and time.
Pipi’s Restaurant is one of Coolangatta’s latest additions and
is a Mediterranean dining darling. They’re a sashimi
and oyster bar located in Nobby’s at The Oxley where
relaxed indulgence is the vibe. The restaurant’s ethos revolves
around exquisite seafood, with salt-kissed caviar bumps and tempura Moreton Bay bugs on milk buns to show for it.
“The Star Gold Coast Casino Online is my top pick for slots. The welcome bonus gave me a huge boost, and I was playing in minutes. Fast withdrawals too!” We
are committed to responsible gaming and offer tools such as deposit and time limits,
loss tracking, self-exclusion, and direct links to
professional help. Our interface and customer service are
built to accommodate a wide range of players across Australia and beyond.
Shuck is another fine dining gem that’s a must for
all with a deep appreciation for seafood. If you’re a fan of all
the ocean eats, grab yourself a platter and let the good times (and full bellies) roll.
The Lazy LobsterIf you’re seeking a seafood platter that doubles as an eating
competition, look no further than The Lazy Lobster. Their huge
seafood platters are legendary for a reason with fresh
king prawns, smoked salmon, mixed oysters, barbequed
bugs and prawns three ways – barbequed, battered and smothered in garlic.
George’s ParagonThose who know seafood know George’s Paragon is where it’s
at when it comes to seafood on the Gold Coast.
To find out more about JW Marriott’s dining delights and
to book a table, click here.
References:
https://blackcoin.co/casino-game-bank-craps/
Whether you prefer skill-based games like Blackjack and Baccarat or
chance-driven games like Pokies and Roulette, Australia’s top-rated online casinos have something for everyone.
Australian players can enjoy reliable and secure online casinos,
where their funds and personal data are safeguarded.
Live dealer games bring the excitement of a real casino straight to players, creating an immersive and unforgettable experience.
Promoting responsible gaming is crucial in the Australian online
casino landscape, enabling players to enjoy their gaming
sessions while maintaining control over their gambling
habits. The quality and diversity of software and games play a crucial role in providing an outstanding online casino experience.
After my pokies session, I tried a couple of unusual live casino games like Monopoly and Andah Bahar (just to take a break from the usual
blackjack and roulette), and the experience was overall great.
So far, so good – gameplay was stable, the games loaded really fast, and there were enough categories to filter out the
pokies and find what I wanted. Stay Casino
makes a top case for itself with some of the most varied bonuses on the Australian online gambling
market, along with a great pokies selection to
back it up. It’s got a truly unique website design, offers a great welcome
bonus and no deposit bonuses, provides excellent user experience overall, and is very
much deserving of the #1 spot on my list. If a casino looks generic, it usually IS generic, and I’ve got nothing against mediocrity – but this is
a list of the best online casinos in Australia after all.
This means that online casinos cannot operate legally in Australia.
Learn how setting a limit can add to a better gambling experience.
Crown Sydney reserves the right to refuse an application for Casino Membership or access of any person to the Crown Sydney Casino at
any time for any reason. Crown Sydney Casino membership is subject to the Casino Membership Policy.
Crown Sydney Casino membership is not guaranteed, and additional
checks will take place that may require further review before
entry can be granted.
Discover premium entertainment at Crown Casino —
Australia’s leading destination for world-class gaming,
luxury hotels, fine dining, and unforgettable experiences.
With its sophisticated layout, exclusive member access, and premium service,
Crown Sydney offers a curated selection of games designed for
the most discerning players in Australia and beyond.
Discover the pinnacle of elegance at Barangaroo — exclusive gaming, harbour views,
elite dining, and luxury accommodation await. All links to games
and casino access at Crown Sydney apply only to Crown Rewards members with a valid Crown Sydney Casino Membership.
Earn points and rewards while playing casino games and enjoying vacations
at each of Crown’s three world-class resorts.
Nestled in the heart of Barangaroo, Crown Sydney redefines luxury with its breathtaking skyline, world-class gaming floor, and refined experiences across dining, hospitality, and wellness.
Electronic table games are also available at the casino.
Further on in the review, you will see a description of all the
available casino games and brief rules on them.
This makes the casino accessible and comfortable
for guests from different countries.
References:
https://blackcoin.co/complete-list-of-las-vegas-casinos/
Unlike subscription-based platforms like Netflix or Hulu, TubiTV
is entirely free, supported by advertisements,
and does not require a monthly fee or account to
start watching. While it does offer a great selection of TV shows,
Tubi has a reputation for being the best place to watch free movies online.
Tubi has an extensive library with content across all genres all for free and available
to watch now. You can watch live TV for free on Tubi across a host of
different channels.
Star, which operates casinos in Brisbane, the Gold
Coast and Sydney, entered a trading halt before the Australian share market opened on Friday after failing to post its half-year financial
results. Star’s board remains unable to sign off on and
lodge its half-year financial results due to the ongoing uncertainty and its shares remain suspended from trading on the ASX.
The failure to secure the $750 million deal has forced the company to try and shore up an alternative arrangement
with US casino group Bally’s. Star warns its future remains uncertain and
its shares will not be able to return to trade until it is able to secure cash and lodge
its financial accounts. Star investors who got excited on Monday by the left-field emergence of a mystery Macau buyer of the casino’s shares would be wise
to curb their enthusiasm.
References:
https://blackcoin.co/netbet-casino-erfahrungen/
All the top Australian casino sites we recommend
meet these standards, making it easy for you. These are perfect for players who enjoy competition and want more excitement than just spinning the reels solo.
Table games like blackjack and baccarat might be your go-to.
Casinonic drops a solid A$7,500 in bonus cash and gives you access to 700+ jackpot pokies, including high-volatility options that reward
patience and timing. It ranks among the best Bitcoin casinos, where you
get A$8,000 + 400 free spins welcome package for a strong start.
Neospin is the best Australian casino online.
No worries – customer support is available 24/7 via email and live
chat at this Australian safe online casino.
By partnering up with providers like BGaming, BSG, IGT,
Mascot, and other well-known names, this safe online casino Australia site
guarantees the safest gaming experience for its users.
For existing users, this safe Aussie online casino hosts various
tournaments with some of the best prizes, which make your gaming experience even more exciting.
We’re mighty impressed with the A$4,000 offer and the brilliant range of games you can play with it.
Outside of pokies, you’ll find a ton of live dealer games from Atmosfera and TV Bet, amongst others, and
some neat video roulette and blackjack games.
us online casinos that accept paypal
References:
https://diseotuweb-w9a.com/employer/paypal-online-casinos-best-us-casinos-accepting-paypal-payment-method/
paypal casino online
References:
shemcareers.co.za
us online casinos paypal
References:
starsgrp.net
online casino real money paypal
References:
http://www.jobindustrie.ma
mobile casino paypal
References:
placifyconnect.com
paypal casino usa
References:
healthcarejobies.com
Can you be more specific about the content of your article? After reading it, I still have some doubts. Hope you can help me.
Your point of view caught my eye and was very interesting. Thanks. I have a question for you. https://accounts.binance.com/en-ZA/register?ref=B4EPR6J0
Thank you for your sharing. I am worried that I lack creative ideas. It is your article that makes me full of hope. Thank you. But, I have a question, can you help me? https://www.binance.info/kz/register?ref=K8NFKJBQ
Your article helped me a lot, is there any more related content? Thanks! https://www.binance.com/register?ref=IHJUI7TF
Thanks for sharing. I read many of your blog posts, cool, your blog is very good.
I don’t think the title of your article matches the content lol. Just kidding, mainly because I had some doubts after reading the article.
Your point of view caught my eye and was very interesting. Thanks. I have a question for you. https://www.binance.com/register?ref=JW3W4Y3A