
The Dow Jones Industrial Average (DJIA) has had an impressive rally in recent weeks, defying global uncertainties and macroeconomic headwinds. However, the recent price behavior on the 1-hour chart indicates a potential pause or reversal as the index approaches a major resistance zone around 45,076. In this article, we’ll dive deep into the technical setup using tools like Bollinger Bands, trendlines, support/resistance, and volume behavior, and evaluate whether the Dow is gearing up for a bullish breakout or faces a short-term correction.
🧭 Key Technical Highlights:
| Indicator | Reading |
|---|---|
| Last Price | 44,416.50 |
| Resistance | 45,076.99 |
| Support Zones | 44,200 / 44,000 / 43,600 |
| Bollinger Bands (20, 2) | Upper: 44,816.43 / Middle: 44,460.53 / Lower: 44,104.63 |
| Trendline Support | Broken |
| Short-Term Bias | Consolidation |
🔍 Price Structure Analysis:
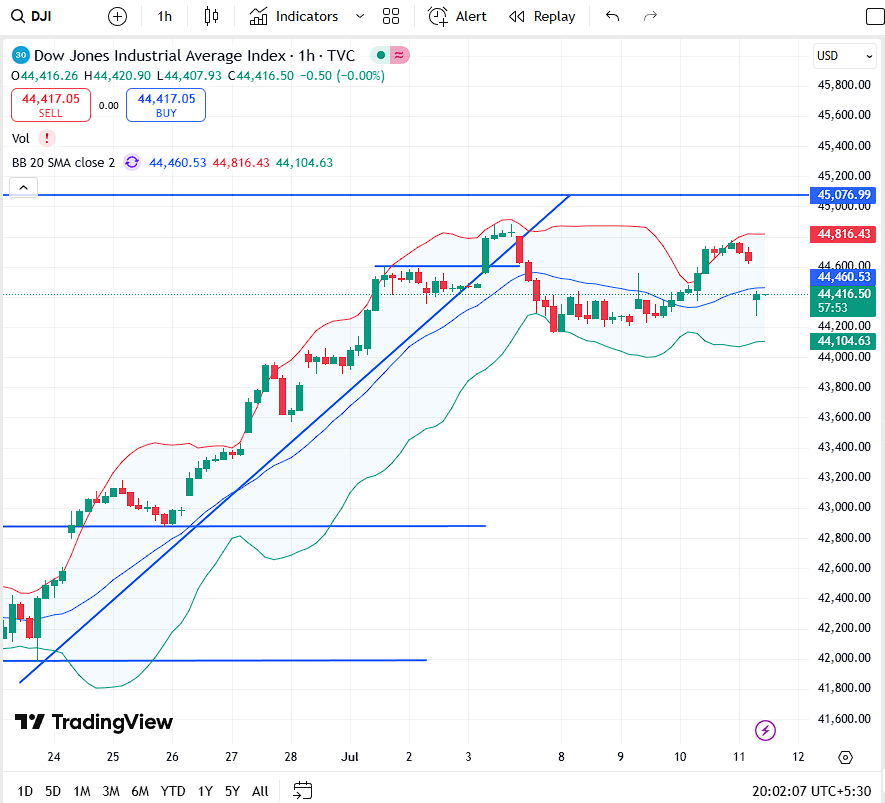
The 1-hour chart clearly shows that DJIA had a well-defined uptrend from late June into early July. Price action respected a rising trendline, which acted as dynamic support until July 5. After peaking near 45,076.99, the index broke below the trendline, indicating that bullish momentum had weakened.
Despite this breakdown, the Dow has found a temporary base near 44,200 and has been oscillating between 44,000 and 44,800, signaling a range-bound phase or sideways consolidation.
📉 Bollinger Bands Insights:
The Bollinger Bands give us insight into volatility and potential breakout zones:
- Upper Band (~44,816): Price touched and rejected this level, showing strong resistance.
- Middle Band (SMA 20) (~44,460): Acting as dynamic support and current hovering zone.
- Lower Band (~44,104): If price breaks below 44,200, this level could be tested.
🔎 Narrowing of the bands suggests a volatility squeeze – a breakout is imminent.
🛑 Major Resistance – 45,076.99:
This level is critical:
- It has acted as the recent top.
- A strong breakout above this could result in a fresh rally towards 45,400 or even 45,800.
- But repeated rejections near this level indicate seller presence and hesitation.
📌 If bulls want to retain control, this level must be breached with volume confirmation.
✅ Support Zones to Watch:
- 44,200: Closest support where recent candles found buyers.
- 44,000: Round number support and Bollinger lower band target.
- 43,600: Previous resistance turned support.
If the price slips below 44,200, it could invite short-term selling pressure, taking it toward the lower Bollinger band and historical support near 44,000.
📊 Volume & Trendline Breakdown:
- Volume dropped during the sideways phase post July 5.
- A bullish breakout without volume may be false.
- The trendline breakdown around 45,000 confirms that buyers are losing strength.
🔁 Trading Strategy Insights:
🟢 Bullish Scenario:
- Wait for a clear breakout above 45,076.
- Ensure volume expansion for confirmation.
- Target zones: 45,400 → 45,800.
🔴 Bearish Scenario:
- If price breaks below 44,200, initiate shorts.
- First target: 44,000, then 43,600.
- Stop-loss above middle Bollinger band or resistance zone.
🧠 Conclusion:
The Dow Jones has enjoyed a solid rally but is now testing a crucial inflection point. As technical indicators suggest a tightening range and momentum fatigue, traders should watch 45,076 on the upside and 44,200 on the downside.
“The market is currently caught in a decision zone – breakout could invite another wave of buyers, while breakdown may lead to short-term profit booking.”
🔗 Internal Link Suggestions (for SEO & Engagement):
📌 Disclaimer:
This analysis is for educational purposes only. Stock market investments are subject to market risks. Always consult a SEBI-registered advisor before taking investment decisions.
Thank you for your sharing. I am worried that I lack creative ideas. It is your article that makes me full of hope. Thank you. But, I have a question, can you help me?
Can you be more specific about the content of your article? After reading it, I still have some doubts. Hope you can help me.
Can you be more specific about the content of your article? After reading it, I still have some doubts. Hope you can help me.