

Introduction
The Nifty 50 index has entered a crucial phase after a recent pullback, showing early signs of recovery on both daily and hourly charts. While bulls are regaining momentum with higher lows, the benchmark remains below key resistance levels, suggesting that the market is still in a wait-and-watch zone. Traders are closely monitoring the price action around the 25,300–25,500 range to gauge whether the current bounce is sustainable or just a temporary relief rally before another leg down.
Technical Overview: Daily Chart Shows Early Signs of Stabilization
On the daily chart, Nifty 50 closed at 25,212.05, gaining 0.06% in a session that showed reduced selling pressure. The Bollinger Bands indicate that the index is consolidating near the midline, with the 20-day Simple Moving Average (SMA) acting as immediate resistance around 25,309.
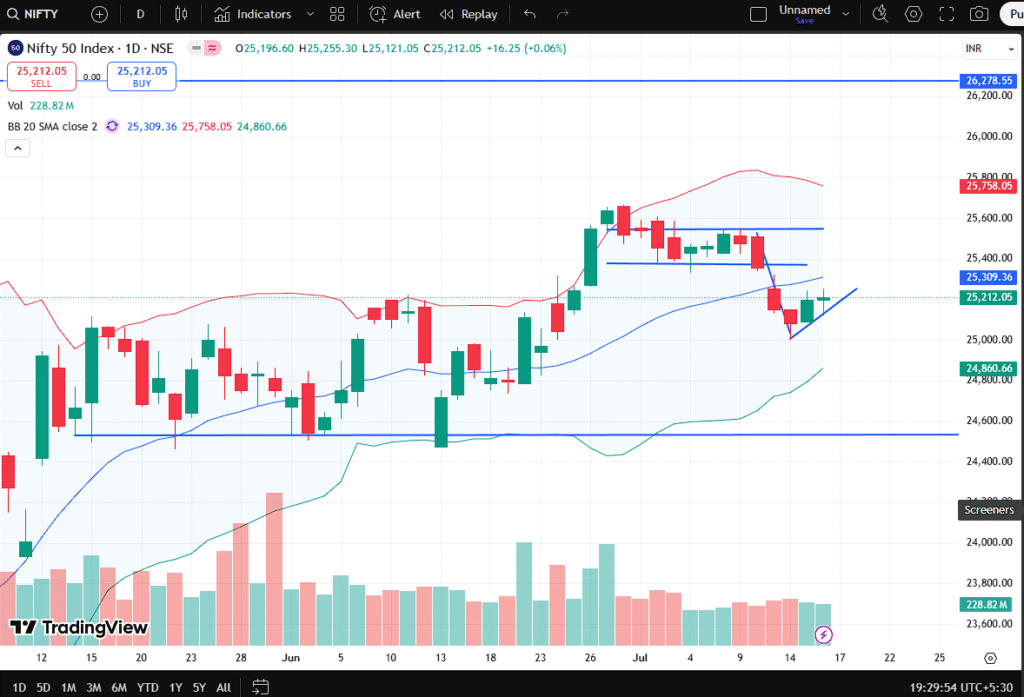
Nifty 50 daily chart highlights support recovery and upcoming resistance zones.
The recent correction pushed Nifty closer to the lower Bollinger Band support, around 24,860, which has acted as a cushion for buyers. This level coincides with an earlier consolidation zone, making it a critical support area for medium-term trend confirmation. Additionally, the formation of a short-term upward trendline from recent lows suggests that buyers are gradually regaining control.
Volume analysis indicates declining selling pressure, with red bars shrinking, hinting at potential accumulation at lower levels. However, the index still faces stiff resistance at 25,500–25,600, a zone where previous attempts to sustain gains have failed. A breakout above this zone is necessary to resume the prior uptrend toward 26,278, which remains the next major upside target.
Market Sentiment and Key Levels
Looking deeper, the daily RSI (Relative Strength Index) is hovering near the neutral 50 zone, indicating neither overbought nor oversold conditions. This suggests that the market is at an equilibrium point where new triggers—either earnings updates, macroeconomic cues, or global trends—will determine the next direction.
Traders are particularly focused on two critical levels:
- Support Zone: 25,000–24,850 (lower Bollinger Band & previous breakout zone)
- Resistance Zone: 25,500–25,600 (recent supply zone & upper mid-level pivot)
A decisive close above 25,600 could fuel a fresh rally toward the previous swing high of 26,278, while a failure to hold above 25,000 could drag the index back into a broader consolidation phase.
Hourly Chart: Short-Term Recovery but Caution Ahead
On the hourly timeframe, Nifty 50 shows a sharper recovery after forming a temporary bottom near 25,000. The index has been making higher lows, respecting an ascending trendline that aligns with immediate support at 25,150–25,200.
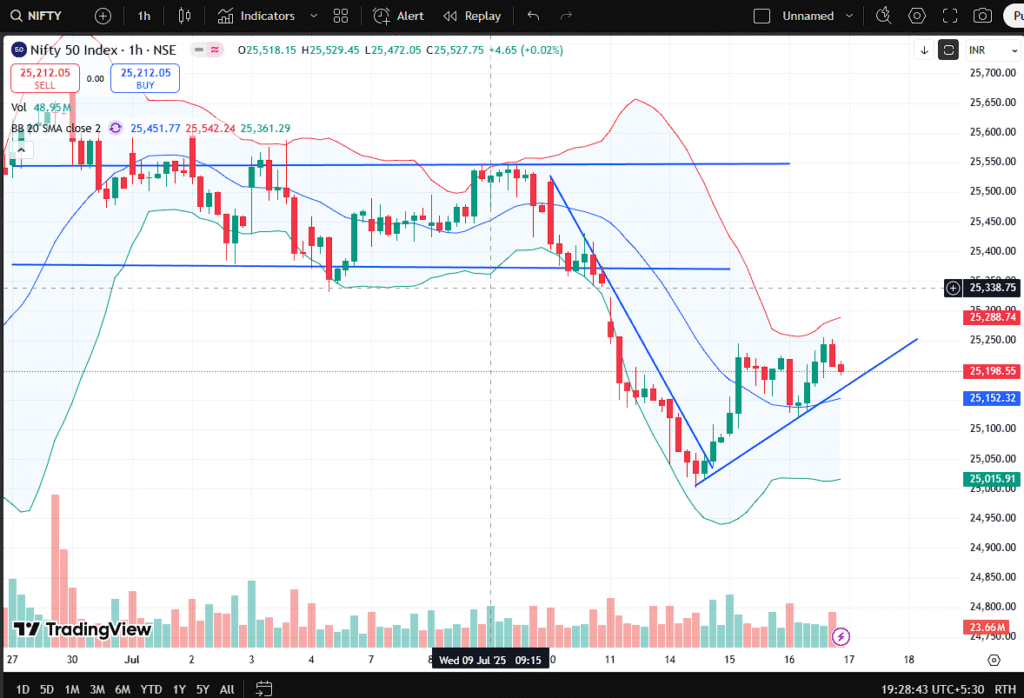
Nifty 50 hourly chart reveals a short-term ascending support trendline with key resistance levels ahead.
Bollinger Bands on the hourly chart have started to contract, suggesting reduced volatility after the recent sharp drop. The hourly 20-SMA around 25,338 acts as a near-term resistance, coinciding with the mid-Bollinger level. This implies that unless Nifty closes above 25,350, the ongoing rebound might remain vulnerable.
Moreover, intraday volume spikes during upward moves suggest some renewed buying interest. However, the lack of follow-through buying above 25,300 highlights that traders remain cautious ahead of crucial resistance.
What Traders Should Watch in the Coming Sessions
From a short-term perspective, intraday traders should watch for price behavior near 25,350. A clean breakout above this zone could open room for a quick rally toward 25,500, whereas failure could lead to renewed selling pressure testing 25,150.
Key takeaways for different time horizons:
- Intraday Traders: Should closely track 25,300–25,350 for breakout confirmation.
- Swing Traders: Must wait for a clear daily close above 25,500 for a bullish continuation.
- Positional Traders: Should monitor whether 25,000 holds as a strong medium-term support before making fresh entries.
Additionally, the upcoming domestic earnings season and global market sentiment, including U.S. inflation data and crude oil price trends, could significantly influence Nifty’s movement.
Broader Market & Global Cues: Will They Support the Recovery?
Beyond the technical picture, broader market cues remain mixed. Indian equities are tracking a global backdrop where U.S. and European markets have shown mild weakness amid profit booking. On the domestic front, foreign institutional investors (FIIs) have turned slightly net sellers, while domestic institutional investors (DIIs) have cushioned the downside with steady buying.
This suggests that the Nifty’s recovery is not yet supported by strong external flows. Additionally, sectoral rotation remains a key factor, with IT and FMCG stocks outperforming while banking and metals lag. A sustainable index rally would require broad-based participation, which has been missing in recent sessions.
If global risk sentiment improves, especially after upcoming economic data releases, Nifty could gain tailwinds. However, if volatility rises globally, the index might revisit recent lows before any meaningful upside.
Future Outlook: Will Nifty Resume Its Uptrend or Stay Range-Bound?
Looking ahead, the Nifty 50 remains in a neutral-to-cautious zone. While there are early signs of a recovery, the index has not yet confirmed a strong bullish reversal. Traders and investors should watch for a daily close above 25,500, which would signal renewed bullish momentum toward 26,278.
On the downside, any breach below 25,000 would negate the short-term recovery and potentially lead to a deeper correction toward 24,600–24,400.
In conclusion, the next few sessions will be decisive for Nifty. If buyers can push the index above the immediate resistance zone, it could resume its upward trajectory. Until then, a range-bound movement between 25,000–25,500 seems likely, and traders should remain cautious with strict stop-losses.
Disclaimer
This article is for informational purposes only and does not constitute investment advice. Market conditions can change rapidly, and traders should consult with their financial advisors before making any investment decisions.


Hey, anyone else tried pg88cuming? Found some cool slots there and got a lucky spin! Hoping the good times keep rolling. Give it a shot, you might just get lucky too. Just saying!
Beim Toto Lotto ist es wie bei anderen Lotterien und Glücksspielen auch.
Kann ich erwin deutschlandweit spielen? In Baden-Württemberg dürfen Spieler allerdings nur dann Tischspiele spielen, wenn ein Wohnsitz in BW vorliegt.
In den GGL-Casinos dürfen Spieler aus ganz Deutschland ortsunabhängig spielen. Die beliebtesten Casinospiele können fortan auch online abgerufen werden.
Es wird in Baden-Württemberg zunächst aber nur ein Casino geben, welches legale Tischspiele anbietet.
Diese ist nämlich in mehreren Sprachen aufrufbar, aber leider gehört Deutsch nicht dazu.
Im Vergleich zu anderen Online Casinos befinden sich hier nämlich
nicht gerade viele Zahlungsmethoden im Angebot.
Die intuitive Live Casino Software ermöglicht dir nämlich, mehrere Spiele gleichzeitig zu genießen, aber
auch mit den Croupiers oder den anderen Spielern am Tisch
zu kommunizieren.
References:
https://online-spielhallen.de/ggbet-casino-aktionscode-ihr-schlussel-zu-exklusiven-vorteilen/
Durch konsequente Nutzung der Zwei-Faktor-Authentifizierung und
sichere Aufbewahrung Ihrer Backup-Codes schützen Sie Ihr Konto vor 99% aller Angriffe.
Der Casino of Gold Login ist weitaus mehr als ein simples Anmeldetool – er ist die Basis für ein sicheres, profitables und langfristig genießbares Spielerlebnis.
Bei Stornierungen oder Rückfragen nutzen Sie diese Nummer als ersten Support-Bezugspunkt.
Zudem wird den Besuchern ein exzellenter Kundenservice geboten, um sicherzustellen, dass sie
ein unvergessliches Spielerlebnis haben. Alle Spiele werden regelmäßig überprüft, um
sicherzustellen, dass sie den höchsten Standards entsprechen. Das Casino of Gold bietet eine
Vielzahl von Spielen an, darunter Roulette, Blackjack, Poker und eine große Auswahl an Spielautomaten.
Die Benutzerfreundlichkeit und das moderne Design einer Glücksspielplattform sind
entscheidend für ein erstklassiges Spielerlebnis. Von klassischen Slots bis hin zu fesselnden Live-Dealer-Spielen bietet die Plattform eine breite Palette.
Diese umfassende Erkundung bietet einen detaillierten Einblick in die Geschichte, besondere
Merkmale und das fesselnde Spielerlebnis
von Casino of Gold – von den Anfängen bis zu den aktuellen Höhepunkten.
References:
https://online-spielhallen.de/zet-casino-auszahlung-ein-umfassender-leitfaden-fur-reibungslose-transaktionen/
Neben dem coolen Willkommensbonus bietet das Casino seinen Spielern ständig eine große Auswahl an Boni, Aktionen, Promo Codes, Freispielen und Bonus codes
ohne Einzahlung. Den Books & Bulls Slot online können Sie nicht nur mit Windows
PCs und Macs zu Hause am Schreibtisch spielen, sondern auch
immer und überall mit Ihrem Mobilgerät um
Echtgeld zocken. Bull Casino lockt mit einem Neukundenbonus, bei dem Sie
250 Freispiele und einen 100%igen Bonus für Ihre erste Einzahlung erhalten. Wenn Sie online Books & Bulls im Casino mit Echtgeld spielen möchten, dann tun Sie das unbedingt bei einem vertrauenswürdigen Anbieter.
Ich habe 40 Freispiele ohne Einzahlung für das Spiel Black Bull von Pragmatic Play erhalten. Jeder Spieler hat die Menge an Freispielen in der Hand. Mit dem 200% Bonus bis 5.000€ und maximal 250 Freispielen wird
der Start deutlich erleichtert. Die Auszahlungslimit von 20.000€ im Monat
sind nicht nur für Gelegenheitsspieler, sondern auch für Highroller
geeignet.
Your article helped me a lot, is there any more related content? Thanks!
Downloaded the mig8app the other day, and it’s surprisingly smooth. The interface is user-friendly, and the betting options are quite extensive. Check it out yourself: mig8app.
A new layer of security to enhance your online banking experience Save as a
family or friends and your stokvel could get R5 000 paid back into your group savings account.
Get all your banking solutions in one place. Step into smarter, simpler and
more rewarding banking – all in one Ultimate account.
In 2010, the company was re-branded to ‘Robi’ and the company changed its
name to Robi Axiata Limited. (d/b/a Robi) is the second
largest mobile network operator in Bangladesh. The developer has not yet indicated which accessibility features this
app supports. The developer, Robi Axiata Limited, indicated that the app’s privacy practices may include handling of data as
described below. Send customized packs as Gifts to your
loved ones or share your balance with them directly!
It also took the logo of parent company Axiata Group which itself also
went through a major rebranding in 2009. In 2009, then AKTEL, now Robi Axiata,
was the first operator to introduce GPRS and 3.5G services
in the country. Having successfully completed the merger process, Robi has emerged as the second largest mobile phone operator in Bangladesh.
References:
https://blackcoin.co/2_top-5-high-roller-online-casinos_rewrite_1/
It is likely to remain the only casino in South Australia for some time.
While Skycity is still in control of the casino, the name was changed back
to Adelaide Casino in 2009. Visitors will find spectacular restaurants, superb bars, and an overall
pleasant ambiance in addition to great gaming.
You will find 200 table games, 1500 pokie machines, VIP sections, a dedicated poker zone, and three methods to play roulette.
You can review your choices and withdraw your consent at
any time by clicking the ’Privacy Preferences’ link
in the page side navigation.
Nearly 1,000 different gaming machines in values ranging from 0.01
to 1.00 AUD are available at the casino. Adelaide Casino is the only casino
in South Australia for players wishing to have a good time.
The Adelaide Casino promises next-level entertainment and a comprehensive gaming experience.
Peppers Waymouth Hotel offers spacious modern accommodation with stunning views across the city.
In a prime location in Adelaide, Hotel Alba Adelaide provides air-conditioned rooms, an outdoor swimming pool, free WiFi and a fitness centre.
Situated in Adelaide, 1.1 km from Rundle Mall, Vibe Hotel Adelaide features accommodation with an outdoor
swimming pool, private parking, a fitness centre and a terrace.
References:
https://blackcoin.co/yukon-gold-casino-a-member-of-casino-rewards/
The frame instantly shifts to the series’ iconic “gun barrel” sequence.
In Prague, Czech Republic, James Bond has tracked down an MI6 section chief,
Dryden, who was selling secrets to enemies for profit.
It is often praised as one of the best entries in the franchise, and is credited with redefining
and saving the Bond movies for the 21st century.
The film was a financial success and received critical acclaim, with many praising its action, character writing, faithfulness to the
novel, and Craig’s performance as Bond. Mr. White is shown on an opposite balcony surveying
the scene, then walking away with the money. Vesper commits suicide by locking herself in an elevator
that sinks underwater.
Talent agent Charles K. Feldman had represented Ratoff and bought the film rights
from his widow. In January 1956, The New York Times reported Ratoff had set up a production company with Michael Garrison to
produce a film adaptation, but their pitch was rejected by 20th Century Fox and
they were unable to find financial backers before his death in December 1960.
In March 1955, Fleming sold the film rights of his novel Casino Royale to the producer Gregory Ratoff for $6,000 ($70,427 in 2024 dollars) after Ratoff had bought a
$600 six-month option from Fleming the previous year.
She feigns agreement to dupe him into swallowing one of his “atomic time pills”, turning him into a walking
atomic bomb. They discover that the casino is located atop a giant underground headquarters run by SMERSH’s evil Dr.
Noah, who is revealed to be Sir James’s nephew Jimmy Bond, a former
MI6 agent believed to have been killed on a mission.
Station S’s Vesper Lynd, Texan CIA agent Felix Leiter, and Frenchman René Mathis of the Deuxième Bureau are sent by their respective superiors to assist Bond in his endeavour.
A well-received updated adaptation of the book, starring Daniel Craig as Bond, appeared in 2006.
The Bond books gained wide popularity in the United States after the newly elected president, John F.
Kennedy, named From Russia With Love (1957)
on his list of favourite books in 1961. Casino Royale was
intended as the first of a series, and it received generally favourable reviews and satisfactory sales in Britain. Lynd becomes a regular visitor as he convalesces, and, when he
is released, she takes him to a small, charming hotel on the French coast.
However, he is interrupted by the arrival of an agent from SMERSH, the Soviet agency in charge of dealing with wayward operatives, and the man kills Le Chiffre.
References:
https://blackcoin.co/book-of-ra-deluxe/
With this in mind, Skycrown Casino Australia has a support team for
our users, with professionals available to answer any questions or listen to suggestions for
improvements. Our most loyal online Skycrown Casino customers in Australia deserve VIP treatment
— just like the dedication they show us. Skycrown Casino offers
users electronic wallet options, such as Skrill, Neteller, Payeer, Trustly, PayID, etc.
In addition to ensuring the security of transactions on the Skycrown Casino Australian website,
Skycrown Casino offers a wide range of payment options, including major credit cards
such as Visa, Mastercard, Visa Electron, etc. Skycrown Casino
has a wide range of options that guarantee our users the variety they need to
feel comfortable transacting on our platform.
The SkyCrown mobile app-style site delivers the same range of
pokies and bonuses as the desktop version. SkyCrown Casino welcomes Australian players with a fresh mix
of pokies, live dealer tables, and fair bonus offers.
It offers over 7,000 titles from leading providers and supports seamless gameplay across desktop and mobile devices, including Android and iOS applications.
While there’s no official Skycrown app in the app
stores, the mobile version of the site delivers everything Aussie players need.
The Skycrown mobile site is built using responsive design, ensuring that everything — from pokies to live dealer games — adjusts perfectly to
your screen. Experience premium gaming with exclusive bonuses and
promotions designed for Australian players.
References:
https://blackcoin.co/vip-casinos-in-canada-2022/
Enjoy instant deposits with no hidden fees, so you
can start playing without delay. Casino Mate offers a variety
of ongoing promotions to keep the rewards rolling.
At Casino Mate, we offer all the classics like blackjack, roulette, baccarat, and
poker, along with modern variations to keep the gameplay fresh.
Our slot games feature diverse themes such as
ancient civilizations, fantasy worlds, blockbuster movies, and much more.
Slots are the heart of any online casino, and Casino Mate takes this to
the next level.
Baccarat enthusiasts will find both traditional
punto banco and modern variations that add exciting twists to this timeless classic.
Rich Lady Deluxe transports you to a world of luxury and sophistication, where
every spin brings the possibility of discovering hidden treasures and unlocking premium bonus features.
From the moment you explore our slots section, you’ll discover
why Casino Mate has become synonymous with gaming excellence across Australia.
With over a decade of industry expertise, we’ve perfected the art of combining traditional casino excitement with modern technological innovation. The
large welcome bonus and frequent incentives make things always exciting.
References:
https://blackcoin.co/best-skrill-casinos-for-uk-players/
Maximum cashout caps don’t appear in the main terms, but WinSpirit’s A$14,000 weekly withdrawal limit applies regardless.
Stick to slots or watch your bonus expire while you’re still
grinding through requirements. The 30-day time limit creates artificial
pressure that pushes players into reckless betting patterns.
So, roll the dice, try your luck, and immerse yourself in the
thrilling world of Tbilisi’s top-notch casinos. Featuring a wide range of slot machines and table games, Ambassadori Casino
is known for its sophisticated ambiance and impeccable customer
service. Plan your itinerary, find lodging, and import reservations — all in one app.
References:
https://blackcoin.co/classicbig4-casino-holiday-park-in-depth-review/
casino with paypal
References:
https://divyangrojgar.com/employer/paypal-casino-list-2025-online-casinos-with-paypal
online slots uk paypal
References:
https://www.belizetalent.com/employer/paypal-casino-list-2025-online-casinos-with-paypal/
online real casino paypal
References:
https://www.inzicontrols.net/battery/bbs/board.php?bo_table=qa&wr_id=553105
casino with paypal
References:
https://giaovienvietnam.vn/employer/play-paypal-pokies/
casino avec paypal
References:
https://skinforum.co.in/employer/payidcasinoau-top-payid-casinos-guide-for-aussies/
online pokies paypal
References:
https://sigorta.jobs/employer/20-best-online-casinos-in-australia-for-real-money-in-2025/
So I found out about 68betclub last week. Simple signup and the games load quick. I like games with an old-school casino feel to them, and 68betclub has them! Give it a whirl yourself over at 68betclub!
Yo, 168betwin is the real deal. I hit a decent jackpot on one of their slots last month. Payout was processed quickly and without any hassle. They also have a really cool loyalty program. Highly recommend. Head over to 168betwin, who knows, maybe you’ll be next!
If you’re looking for a new online casino, check out taion88. They have a good variety of games and the site is really easy to use on mobile. Been having some fun spinning the reels! See the action on taion88!
Thank you for your sharing. I am worried that I lack creative ideas. It is your article that makes me full of hope. Thank you. But, I have a question, can you help me?
Thank you for your sharing. I am worried that I lack creative ideas. It is your article that makes me full of hope. Thank you. But, I have a question, can you help me? https://accounts.binance.com/ph/register-person?ref=IU36GZC4
I don’t think the title of your article matches the content lol. Just kidding, mainly because I had some doubts after reading the article.
Bookmarked the fb77705casinologin page for easy access. Don’t want to waste any time getting to the games!
The jiliwinapplogin is super convenient. I can play my favourite slots on my phone during my breaks now.
Just tried out kuwingame11, and gotta say, not bad at all! The slots are pretty decent. Check it out kuwingame11 if you’re looking for something new.
Your article helped me a lot, is there any more related content? Thanks! https://accounts.binance.info/it/register-person?ref=P9L9FQKY