

Introduction:
India’s benchmark index, the Nifty 50, continues to hover near a key support level at 24,456, showing signs of weakening momentum amid broader global and domestic uncertainties. The index has now dropped to 24,574.20, registering a loss of 75.35 points (-0.31%) in the latest session. With price action sticking close to the lower Bollinger Band, traders are asking—will this be a short-term consolidation or a breakdown signaling deeper correction?
Weakness Persists as Nifty Nears Lower Bollinger Band and Crucial Support
Nifty’s recent performance shows a steady decline from its July highs, with the price now struggling to stay above the 24,456 support line. The daily chart highlights a classic breakdown structure, where a series of lower highs and lower lows are forming. The index is also trading below the mid-Bollinger Band (20-day SMA) set at 24,949.15, showing that the momentum remains under bearish control.
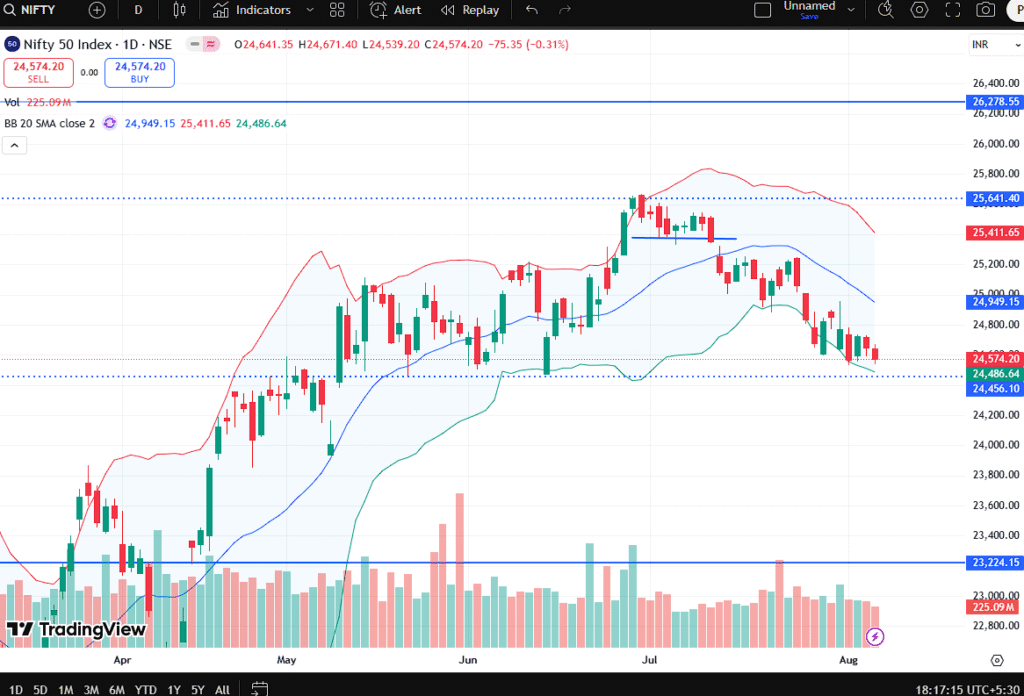
“Nifty 50 chart shows prolonged downtrend and test of 24,456 support zone with bearish volume.”
This pattern suggests sustained selling pressure, especially as the candles consistently close near or below the lower Bollinger Band. The volatility is expanding, as evident from the widening bands, which often precedes sharp directional moves. With volume spikes on red candles and lower volume on green ones, the bias appears firmly tilted in favor of the bears.
If this support fails to hold in the upcoming sessions, the next visible downside target lies at 23,224—a level last seen in May and backed by high-volume accumulation. On the upside, Nifty must reclaim 24,949 and then 25,411 to reestablish bullish confidence.
Mid-Term Outlook: Breakdown from Consolidation Signals Trend Weakening
The Nifty 50 had previously formed a consolidation zone between 24,950 and 25,641 from mid-June to mid-July. This range provided a cushion for bulls during periods of selling pressure. However, in the last two weeks of July, the index broke below this zone with conviction, supported by increased volume, and has since failed to re-enter the upper half of the Bollinger Band.
This kind of breakdown usually signals a shift in market sentiment from bullish to neutral or even bearish. As per technical patterns, breakdowns from such horizontal consolidations often lead to measured moves equivalent to the width of the range—in this case, around 700–800 points—which suggests the index could slide below 24,000 if current levels don’t hold.
Another concerning signal is the inability of the index to rebound despite broader market cues. Global equities like the Dow Jones and S&P 500 saw brief relief rallies, but Nifty has continued to grind lower, indicating domestic concerns weighing heavier on investor sentiment.
This includes:
- Persistent FII outflows amid rising U.S. bond yields.
- Weak earnings from mid-cap and banking names.
- Policy uncertainty ahead of state elections.
- Inflationary pressure due to monsoon irregularities.
Analysts also highlight that Nifty’s RSI is nearing oversold territory, currently hovering near 32–35 levels. While this doesn’t guarantee a reversal, it indicates that a technical bounce could be expected if macro conditions stabilize.
Sectoral Drag: IT, Banks, and FMCG Add to the Index Pressure
The Nifty’s decline is not just technical—it’s sectorally broad-based. Nifty Bank and Nifty IT, two heavy-weight contributors, have both seen increased selling. While private banks like HDFC Bank and ICICI Bank are holding ground, PSU banks have seen stronger declines. Similarly, top IT names like Infosys and Wipro are facing margin pressure, disappointing investors with subdued quarterly guidance.
FMCG, which had earlier supported the index during periods of volatility, is now also faltering due to input cost concerns and muted rural demand recovery. Even high-beta sectors like Auto and Realty are showing signs of exhaustion.
As a result, the overall market breadth has narrowed significantly. The Advance/Decline ratio on the NSE is turning negative, signaling growing bearish sentiment across the broader markets.
Brokerages like Motilal Oswal and Kotak Securities have revised their near-term Nifty outlook from “sideways bullish” to “watchful bearish,” suggesting traders reduce leverage or stay defensive until the index finds a reliable base.
Will 24,456 Act as the Final Line of Defense Before Panic Sets In?
The 24,456 level, highlighted on the chart, aligns with a previous gap zone formed in early June—a region that had seen strong buying interest. This makes it a psychological and technical pivot. If the bulls manage to hold this support and push Nifty back above 24,800, we could see a short-term rally toward 25,200–25,400. However, the setup remains fragile.
If the support fails, a flood of stop-losses and algorithmic selling may accelerate the decline, dragging the index quickly toward the lower targets at 24,200 and 23,224. Traders should look for high-volume bullish candles to confirm any reversal, else stay on the sidelines or consider short trades with tight risk management.
The Bollinger Band lower curve is currently at 24,486. A daily close significantly below this level would indicate a continuation of the current downtrend.
On the flip side, if the index shows strength and reclaims the mid-band at 24,949 with a bullish engulfing pattern, it could signal a near-term bottom and a possible bounce back above 25,400.
Conclusion: Nifty’s Tipping Point – Breakdown or Bounce Ahead?
The Nifty 50 index stands at a delicate crossroads. Technical patterns, volume data, and broader sectoral weakness point to increasing pressure on the 24,456 support. While this level has historically acted as a strong bounce zone, the lack of positive catalysts makes its sustainability questionable.
Investors and traders should keep a close eye on daily candle formations, macroeconomic news (especially inflation data and FII flows), and global cues from the U.S. and China. Until Nifty shows signs of a convincing reversal, short-term sentiment is likely to remain bearish.
For now, bulls need to protect 24,456 at all costs—or risk a slide into a deeper correction zone that could test 23,000 and below in the coming weeks.
Disclaimer:
This content is meant for educational and informational purposes only. It is not investment advice. Please consult your financial advisor or do your own research before making any investment decisions. The stock market is subject to risks.


Alright, hear me out. I gave mgbett a shot the other day and gotta say, not bad! The interface is pretty slick and I actually managed to snag a small win. Could use a few more promos, but overall, a solid experience. I’d give it another spin!
15win4… short, sweet, and to the point. Does the site match the name, tho’? Only one way to fine out! Let’s visit! 15win4
Your point of view caught my eye and was very interesting. Thanks. I have a question for you.
Thank you for your sharing. I am worried that I lack creative ideas. It is your article that makes me full of hope. Thank you. But, I have a question, can you help me?
777bd3 is my reliable site. It always delivers. It won’t disappoint. 777bd3
777cxgamedownload, definitely recommended if you’re into downloads. Check them out! I think you’ll have a good time. 777cxgamedownload
Hey, been playing on 89fgame lately and it’s actually pretty solid. Good selection of games and the site runs smooth. Definitely worth checking out. 89fgame
Your point of view caught my eye and was very interesting. Thanks. I have a question for you. https://accounts.binance.info/register-person?ref=IHJUI7TF
Thank you for your sharing. I am worried that I lack creative ideas. It is your article that makes me full of hope. Thank you. But, I have a question, can you help me? https://accounts.binance.info/register-person?ref=JW3W4Y3A