

Introduction:
The Dow Jones Industrial Average (DJIA) continues to trade under pressure, closing at 44,098.49, down 13.25 points (-0.03%), and testing the crucial 20-day SMA/Bollinger Band midpoint at 44,402.67. The index recently experienced a breakdown from a short-term range and is now struggling to regain bullish momentum. As the global equity rally pauses, investors are closely watching whether the Dow will bounce from its current zone or roll over for a deeper correction.
Price Action Analysis: Reversal Pattern or Minor Pullback?
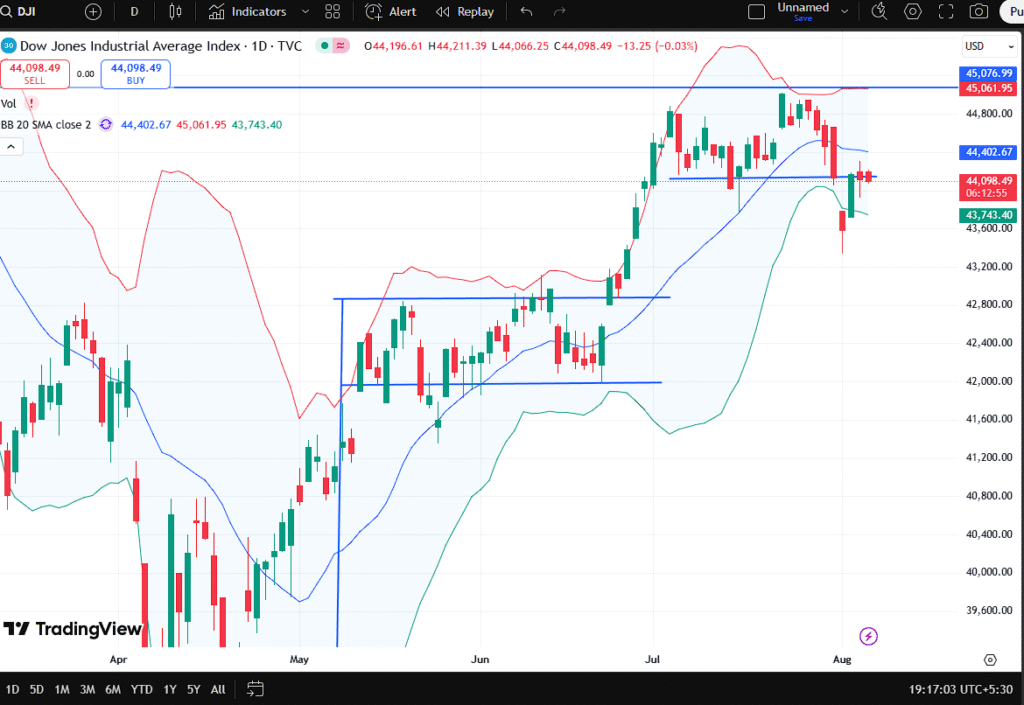
“Dow Jones index showing signs of weakness after a failed breakout, hovering near Bollinger mid-band.”
The Dow had earlier seen a strong uptrend in June, rallying from 42,000 to above 45,000, but now faces resistance near 45,076.99—an area that aligns with the upper Bollinger Band and historical supply zone.
The daily chart clearly shows:
- A breakout from a rectangle range in late June.
- A quick rally, followed by a failed retest and sharp decline last week.
- Price dipping below the 20 SMA (Bollinger midline) and now attempting to reclaim it.
This breakdown-retest setup is technically bearish unless bulls manage a strong close above 44,400–44,600 soon. If not, the pattern may play out into a rounded top formation, leading to lower lows toward 43,200 and 42,000.
Volume is slightly above average on the recent red candles, confirming distribution.
Bollinger Band Clues: Compression Followed by Volatility
The Bollinger Bands (BB 20 SMA) provide key clues:
- Upper Band: 45,061.95
- Mid-Band (20-day SMA): 44,402.67
- Lower Band: 43,743.40
After a period of band compression in June, the Dow exploded upward—but has now returned to retest the breakout zone. This “volatility squeeze followed by expansion” is typical before trend reversals or accelerations. With price closing below the mid-band and struggling to climb above it, the setup now favors the bears.
However, the lower band is not far at 43,743. A bounce from this region is still technically possible and may keep the short-term uptrend alive—but bulls must defend it swiftly.
Horizontal Levels: Reversal or Continuation Zone
The chart shows two major consolidation ranges in the past few months:
- Late April–Early June Range: Between 41,900 and 42,900
- Mid-June–Mid-July Range: Between 43,600 and 44,800
The breakout above the second range initially seemed strong, but the recent pullback shows the market may be testing the validity of that breakout.
Currently, the price is right back in that range. A strong daily close below 43,743 would invalidate the earlier breakout and confirm a bull trap, opening the door for deeper losses toward 42,900.
However, a bounce from the current level and reclaim of 44,800 would signal strength and could pave the way for another leg up toward 45,500–46,000.
Fundamental Headwinds: Fed, Yields & Global Cues Weigh
While the technical structure weakens, macro headwinds are not helping either:
- U.S. Treasury yields have risen, pressuring equity valuations.
- Fed officials have maintained a cautious tone despite inflation progress.
- Earnings season has been mixed, with mega caps outperforming but small/mid caps struggling.
- Geopolitical concerns in Asia and Middle East continue to affect risk sentiment.
These fundamental concerns have contributed to the Dow’s hesitation at higher levels. Notably, the Nasdaq and S&P 500 have held stronger, indicating that industrial and cyclical stocks (dominant in the Dow) are under heavier pressure due to slowing global growth outlooks.
Outlook Ahead: Levels to Watch for Traders and Investors
Key levels from the current chart setup:
| Zone | Level | Action/Significance |
|---|---|---|
| Upper Resistance | 45,076.99 | Major resistance / supply zone |
| Mid-Resistance | 44,800 | Previous breakout level |
| Current Mid-Line | 44,402.67 | Bollinger mid-point / 20-day SMA |
| Immediate Support | 43,743.40 | Bollinger lower band |
| Breakdown Trigger | 43,600 | Bearish confirmation |
| Major Support | 42,000 | April-May base level |
Conclusion: Dow at Decision Point Amid Tight Macro & Technical Pressure
The Dow Jones is at a technical crossroads—a bounce from current levels could reignite the uptrend, while failure to hold above the lower Bollinger Band near 43,743 would confirm a bearish reversal pattern. The next few sessions will be critical.
Aggressive traders can consider short positions below 43,600 with tight stops, while swing traders may wait for a decisive move above 44,800 to reenter long.
Either way, risk management is key. With Fed uncertainty, rising yields, and slowing growth, volatility is expected to remain elevated.
Disclaimer:
This article is for informational and educational purposes only. It does not constitute financial or investment advice. Please consult with a certified financial advisor before making any trading or investment decisions.
Nifty 50 Hovers Near Key Support: Will Bulls Defend 24,456 or Capitulate Further?


Hey there! Looking for a new online winbetonline.net and just seeing what’s out there. if someone have any idea, can you share their experience with me about bonus, games on this site? Check it out for yourself: winbetonline
Klassische Tischspiele wie Roulette, Black Jack oder Poker
und hochmoderne Spielautomaten sowie Shows und
Kulinarik gehören zu ihrem breitem Portfolio. Der Freistadt Bayern ist
reich an Kultur, Ausflugszielen, Urlaubsgebieten und Kurstädten. In dieser Online
Poker-Variante spielen die Teilnehmer nicht
gegeneinander, sondern gegen die Bank. 22bet oder National Casino die du alle aus deiner Stadt oder aus Berlin, Hamburg, München, Leipzig spielen kannst.
Wenn Sie sich gern auf eine gefährliche Mission begeben, können Sie sogar im Casino spielen – oder wenn Sie mehr Geld ausgeben möchten, als
Sie haben, können Sie es hier tun. Außerdem sind
sie nicht auf den wechselnden Verkehr in einem Spielkasino wie
in München angewiesen, sodass sie von überall aus spielen können.
Was uns von anderen Spielcasinos unterscheidet, ist unser erstklassiger Service
durch gut ausgebildetes Personal. Wir bieten moderne und
aufregende Spielautomaten und ein vielfältiges Spieleangebot.
Dafür finden bewährte Instrumente Anwendung, wie zum Beispiel Spieleinsatz- und Verlustlimits,
die von den Usern individuell eingestellt werden können. Für besonderes Amüsement sorgt das Würfelspiel Dice52 neben den klassischen Tischspielen und modernsten Automaten. Juli 1955 eröffnete Schauspielerin Marianne Koch
das Alpencasino. In jedem dieser Häuser erwarten die
Gäste neben Glücksspielen und ausgewählter Gastronomie auch exklusive Events und Veranstaltungen, die
einen Besuch zum unvergesslichen Erlebnis machen.
Allerdings befinden sich in der Umgebung der Landeshauptstadt gleich mehrere Spielbanken, die Münchner Zocker in kurzer Zeit erreichen können.
München ist die drittgrößte Stadt Deutschlands und hat
auch für Glücksspielfreunde einiges zu bieten.
Für die Teilnahme an Glücksspielen in bayerischen Spielbanken und Spielotheken müssen Sie mindestens 21 Jahre alt sein. Sind Sie gewillt eine längere Anfahrt in Kauf zu
nehmen, dann können Sie im Casino Garmisch-Partenkirchen täglich regulär Poker spielen und
am Wochenende Cash Games zocken. Innerhalb der Stadtgrenzen ist es schwierig, Pokerspiele vorzufinden.
References:
https://online-spielhallen.de/lex-casino-top-spielportal-in-deutschland/
Spicycassino is bringing the heat! I’m talking slots, table games, the works! It’s got everything you need for a good night in or a casual spin. And who knows? Maybe you’ll hit the jackpot! Give ’em a look at jackpot 777.
Professional dealers host games in real-time, creating an authentic casino atmosphere from the comfort of your home.
VIP players receive even more benefits, including
a personal VIP manager, customized bonuses, higher
limits, and faster withdrawals. With over 7,000 games and monthly
cashouts exceeding A$8 million, SkyCrown has proven itself as a trusted gaming destination for Australian players.
SkyCrown Casino brings you an amazing gaming adventure with huge bonuses, thousands of games, and
lightning-fast payouts. Yes, Skycrown fully supports AUD for deposits, withdrawals, and
gameplay, so you won’t need to deal with currency conversions or extra
fees.
With a welcome package worth up to A$8,000 plus
400 free spins, there’s never been a better time to join!
Once the game is fixed, you will be notified. To be notified when your game is ready, please leave your email below.
Instead, take a few minutes to review the essentials — license,
security, payments, and game quality.If you’re looking for a casino that ticks all the right
boxes, many Aussie players recommend giving SkyCrown Casino
a try. Forums and comparison sites can be great sources
of honest feedback.In short, never rush into signing up just because
a casino offers flashy bonuses or promises big wins.
Reliable Customer SupportA strong support team shows the casino cares about
its players. Fast & Aussie-Friendly PaymentsThe best
online casinos make it easy for Australians to deposit and withdraw.
References:
https://blackcoin.co/13_vip-slots-casino-review-2022_rewrite_1/
BC.Game offers a very enticing proposition for players who are hunting for the best free spins deals.
There’s also a progress ladder, which allows players to collect points, climb through levels, and unlock
higher multipliers for bonus rewards. Beyond the very positive first impressions left by the modern UI and UX, BC.Game boasts a large selection of games and enticing bonuses.
Its commitment to fairness and security makes it a popular choice for
players looking for a top Bitcoin casino.
Vega.Bet supports responsible gambling with tools like deposit limits,
time-outs, and self-exclusion, which can be set in your account.
After careful review, I deemed that the 2023-launched Ybets Casino provides
a secure gambling site aimed at both casino gaming and sports betting with cryptocurrency.
No, typically, you must meet the wagering requirements attached to the bonus before you
can withdraw any winnings or bonus funds.
Free spins are also a great way to explore the game mechanics and see which slots align with your style.
Online casino gambling is prohibited in Australia.
Sign up to beat the house and all the fun of RocketPlay casino promotions on the go.
You can find games with progressive jackpots
and high RTPs (Return to Player), which means better chances to succeed.
References:
https://blackcoin.co/treasure-island-ti-las-vegas-hotel-casino/
online casino accepts paypal us
References:
https://gomyneed.com/profile/tiaralocklear
us online casinos paypal
References:
cheongchunplant-as.com
Gonna try my luck over at lucky96. Looks promising! Hoping for some decent payouts and a lag-free experience. Anyone else had any good wins there? Worth a punt I reckon. Give it a whirl at lucky96
Feeling nostalgic, heading to win7game for some classic vibes. Remember wasting hours on those games back in the day? Bringing back the good old times! Worth a look-see at win7game
Looking for some fresh games to download. Think 02gamedownload might have what I need. Fingers crossed for some hidden gems! Always on the hunt for new titles. Score some downloads here 02gamedownload