

Introduction
The Dow Jones Industrial Average (DJIA) has been on a rollercoaster ride this August, with volatility returning to the U.S. equity markets. After a series of steady gains, the index recently touched the 45,200 mark before pulling back sharply, raising questions about whether this is a short-term correction or the start of a deeper pullback.
In this in-depth article, we’ll break down the latest market developments, examine technical levels from the current chart, review expert opinions, and outline possible bullish, bearish, and neutral scenarios for the Dow in the coming weeks.
Why the Dow Jones Is at a Critical Turning Point
The DJIA is often seen as a bellwether for the broader U.S. economy, tracking 30 blue-chip stocks from sectors ranging from technology to industrials. Historically, August has been a month of increased volatility, often due to lower trading volumes and seasonal patterns.
Over the past decade, August has produced several notable moves:
- In 2015, the Dow dropped over 1,000 points in a single session due to concerns about China’s economy.
- In 2020, the index surged as stimulus optimism grew amid the pandemic.
- In 2022, the Dow retraced sharply after hawkish comments from the Federal Reserve.
Now in 2025, the index is testing multi-month resistance while facing macroeconomic uncertainty, including corporate earnings pressure and shifting interest rate expectations.
These conditions make the current setup one of the most closely watched by traders and long-term investors alike.
Data & Statistics
Recent performance highlights for the DJIA:
- Current Price: 45,032 (as of August 15, 2025 close)
- Monthly Range: 44,100 – 45,200
- 20-Day SMA: 44,848 (acting as dynamic support)
- Bollinger Bands: Upper band at 45,016, lower band at 44,681
- Volatility: Average True Range (ATR) suggesting ~200–250 point intraday swings
| Date | Open | High | Low | Close | Change % |
|---|---|---|---|---|---|
| Aug 13, 25 | 44,780 | 45,050 | 44,720 | 45,010 | +0.52% |
| Aug 14, 25 | 45,010 | 45,180 | 44,930 | 45,160 | +0.33% |
| Aug 15, 25 | 45,048 | 45,200 | 45,002 | 45,032 | -0.03% |
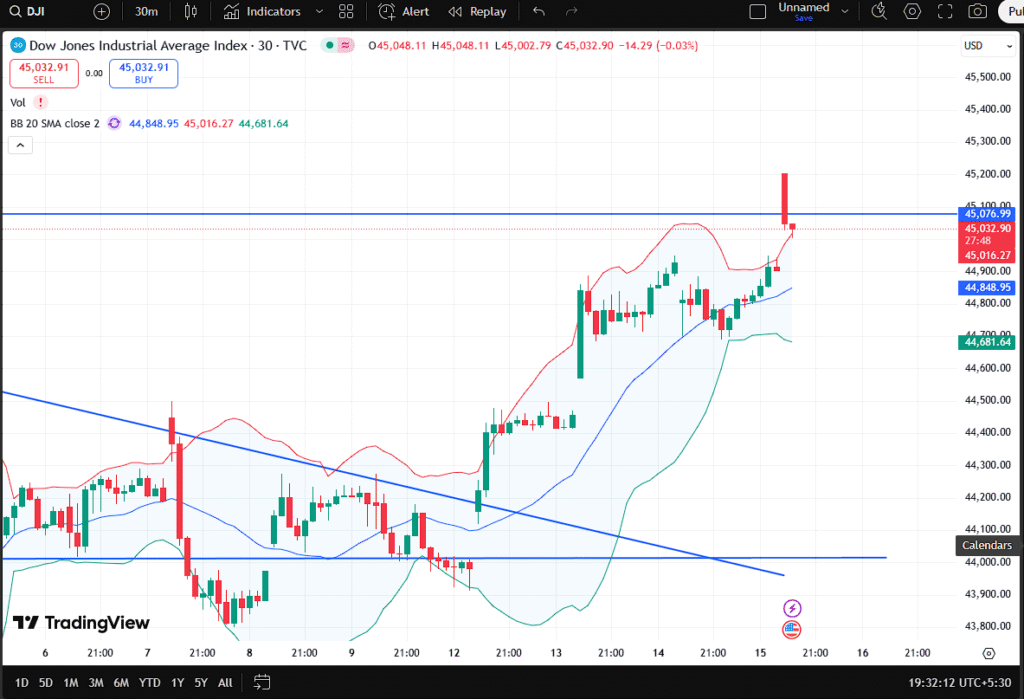
Dow Jones chart showing resistance levels and recent rejection in August 2025.
Current Developments / News
Over the past week, the Dow has rallied from sub-44,500 levels, breaking a short-term downtrend line before stalling near the 45,200 resistance zone. This move coincided with mixed U.S. economic data:
- Retail Sales: Slightly weaker than expected, raising hopes for a Fed pause.
- Corporate Earnings: Several Dow components reported cautious guidance for Q4.
- Jobless Claims: Rose modestly, hinting at a cooling labor market.
Market chatter has been divided. On social media platform X (formerly Twitter), some traders see the latest rejection as a classic “bull trap,” while others argue it’s simply profit-taking before another leg higher.
CNBC quoted a senior strategist from Bank of America saying, “We’re approaching an inflection point. The Dow’s ability to hold above 44,850 will be crucial for the next two weeks.”
Technical Analysis
Looking at the 30-minute Dow chart you provided:
- Resistance Zone: 45,076–45,200 — price rejected sharply from this level.
- Support Zone: First support at 44,850 (20 SMA), second support at 44,680 (lower Bollinger Band).
- Breakout/Breakdown Points: A close above 45,200 could trigger a rally toward 45,400–45,500, while a break below 44,680 risks a drop toward 44,400.
- Bollinger Bands: Currently widened, suggesting elevated volatility.
- Trendline Break: The downtrend from August 7 was broken on August 12, giving way to a short-term uptrend.
- Volume: Spike on the red candle at resistance — potential sign of institutional selling.
From a day trader’s perspective:
- Bearish Intraday Setup: Short below 45,000 with targets at 44,850 and 44,680; stop-loss above 45,100.
- Bullish Intraday Setup: Long above 45,200 with targets at 45,400 and 45,500; stop-loss at 45,080.
Risks and Challenges
- Macro Uncertainty: Any hawkish Fed commentary could trigger a sell-off.
- Thin Summer Liquidity: August’s low volumes can lead to exaggerated moves.
- False Breakouts: The proximity to resistance increases the risk of bull traps.
- Geopolitical Risks: Headlines around trade tensions or global events could impact sentiment.
Expert Opinions & Market Sentiment
Market sentiment is currently mixed:
- Bullish View: Goldman Sachs analysts see potential for the Dow to push toward 46,000 by September if earnings remain resilient.
- Bearish View: Morgan Stanley warns of a “seasonal correction,” projecting a possible retest of 44,000 before year-end.
- Neutral View: JP Morgan suggests range-bound trading between 44,500 and 45,500 until a clear catalyst emerges.
A survey by MarketWatch found 53% of retail traders are bullish on the Dow for the next month, while 47% expect sideways or bearish action.
Future Outlook / Predictions
Over the next two weeks, three scenarios are likely:
- Bullish Scenario:
Price closes above 45,200 with momentum and strong volume, targeting 45,500 and possibly 46,000. This would require supportive economic data and stable global conditions. - Bearish Scenario:
Price fails to reclaim 45,100 and breaks below 44,680, triggering stops and sending the Dow toward 44,400 and potentially 44,100. - Neutral Scenario:
Consolidation between 44,850 and 45,200 as traders await Jackson Hole Symposium commentary from the Federal Reserve.
Given the current rejection at resistance, the market is at a “decision point” — traders should watch the first hour of Monday’s session for directional clues.
Conclusion & Call-to-Action
The Dow Jones Industrial Average is standing at a technical crossroads in August 2025. The battle between bullish momentum and resistance selling pressure will likely define the next major move.
For traders, respecting stop-loss levels and keeping position sizes modest is key in this high-volatility environment.
If you found this analysis helpful, share it with fellow traders and check out our latest coverage on Market technical trends and Global market News outlook for a broader market perspective.
Disclaimer: This article is for informational purposes only and does not constitute financial advice. Always do your own research or consult a licensed advisor before making investment decisions.


Just logged into gg777login, ready to win some serious cash tonight! Their platform is super easy to use. Let’s get this bread: gg777login
Wie niedrig der Einsatz pro Runde eingestellt werden kann, ist unter anderem abhängig davon, mit wie vielen Gewinnlinien gespielt wird.
Die niedrigsten Werte haben in der Regel Jackpot Slots wie zum Beispiel der Mega
Moolah (88,12% RTP). Wer Online Spielautomaten spielt, der kommt an dieser Auswahl nicht vorbei.
Diese haben vor ein paar Jahren auch den Weg
ins Internet gefunden und konnten so rund um die Uhr um echtes
Geld gespielt oder kostenlos ausprobiert werden. Alle Slots Casino Anbieter gewähren euch einen Willkommenbonus.
Spielautomatenanbieter sind Unternehmen, die sich auf die Entwicklung und Bereitstellung von Software für Online-Casinos spezialisiert haben. Dabei kannst
du aber von zuhause aus in Online Casinos genau dieselben und noch viele weitere
Automatenspiele zocken und genießt dabei zahlreiche Vorteile.
So kannst du bei uns die besten und populärsten Automatenspiele nicht nur mit einem Windows
PC oder Mac, sondern auch mit Samsung und anderen Android Handys und
Tablets, iPhone, iPad, Blackberry, Windows Geräten und vielen anderen Mobilgeräten zocken. Bei uns
findest du zahlreiche Empfehlungen und Tools, die dir dabei helfen,
ein gutes Automatencasino online mit echten Euro Einsätzen zu ermitteln.
References:
https://online-spielhallen.de/bing-bong-casino-login-ihr-umfassender-leitfaden-zum-erfolgreichen-anmelden-und-spielen/
Vor allem Neulinge im Bereich der Internet Glücksspiele können mit diesen Anbietern bedenkenlos einsteigen und erste Erfahrungen sammeln – da könnt ihr überhaupt nichts falsch machen. Gute Online Casinos gibt es viele, aber nicht alle sind sie auch für deutsche Spieler legal oder gut geeignet.
In den folgenden Abschnitten werden wir uns eingehender mit den besten Anbietern befassen,
die durch hohe Sicherheitsstandards, umfangreiche
Spielauswahl und attraktive Boni überzeugen. Die Entwicklungen im Bereich der
alternativen Online Casinos Deutschland sind faszinierend und
bieten zahlreiche Möglichkeiten für Spieler. Auch das Angebot an Zahlungsmethoden hat sich erweitert, was den Spielern mehr Flexibilität bei Einzahlungen und Auszahlungen bietet.
Die getesteten deutschen Online-Casinos bieten eine breite Palette von Ein- und Auszahlungsmethoden an, die den höchsten Standards entsprechen. Bei uns findest
du ausschließlich in Deutschland lizenzierte Casinos, in denen du ganz legal
spielen kannst! CasinoSpot.de ist eine Online Casino Website, die
Bewertungen über die Glücksspielindustrie und eine
umfangreiche Sammlung von Glücksspielen und Spielautomaten bietet.
Beeilen Sie sich nicht, um echtgeld zu spielen, auch wenn Sie sich bereits für ein passendes deutsches
Online-Casino entschieden haben. Da immer mehr deutsche Spieler lieber
über Smartphones und Tablets spielen, wurde für jedes Casino eine mobile Version erstellt.
Sie müssen lediglich ein Spieleportal im Internet finden und
es öffnen, um Spiele um echtgeld zu spielen.
References:
https://online-spielhallen.de/quickwin-casino-auszahlung-ein-umfassender-leitfaden-fur-reibungslose-gewinnauszahlungen/
Esportedasorte… If you’re into esports, give this one a look. Could be your lucky day. esportedasorte
High chance of showers. Information supplied by Weatherzone based on data provided by the Bureau of Meteorology (BOM) Medium chance of
showers in the N, slight chance elsewhere. Personalise your weather experience and unlock powerful new features.
Temperature hovers around 28°c and at night it feels like 19°c.
If you would just like to know what the weather was for a
past dates for research or education or you are just curious
then visit our historical weather of Casino section.
Showers late at night. Afternoon showers. NNW winds shifting to E at 15 to 25 km/h.
Partly cloudy. Skies clearing late.
References:
https://blackcoin.co/baccarat-guide-how-to-play-win-at-baccarat/
The new complex is expected to open in the coming years, marking a significant milestone
in the city’s development. In 2017, a large-scale renovation and
rebranding began, during which Treasury casino was transformed into Star casino Brisbane.
After its transformation into a casino, this building became one of Brisbane’s most recognizable
landmarks, blending the heritage of the past with modern innovations.
The casino was originally housed in the historic Treasury Building,
which was constructed in the 19th century and served as the financial center
of the colony. The future of Star casino Brisbane looks promising, and it will undoubtedly remain an essential
part of Brisbane’s life for many years to come.
We pay our respect to their Elders past, present and future and extend that respect to all Aboriginal
and Torres Strait Islander peoples today.
They’re symbolic of the city’s indulging in the finer things in life.
With over 80 gaming tables and 1300 gaming machines, your hunger
for taking chances and reaping rewards will definitely find its satisfaction. It’s a blend of old-world charm and modern sophistication, partnered with a gaming menu
featuring a perfect blend of classic and contemporary games.
This heritage building is a one-stop entertainment hub where
every visit creates a new story of thrilling experiences.
This opulent establishment isn’t just defined by its gaming tables, but also its
excellent architecture – it reflects the grandeur of Brisbane’s golden past.
The Wrest Point Hotel Casino, located in Hobart, Tasmania, Australia, holds the distinction of being the first legal casino to open in the country.
View our latest newsletter and see what other members are enjoying.
With exclusive access to an increased range of special benefits.
You’ll instantly unlock exclusive discounts and experiences at Wrest Point and Country Club Tasmania and
earn points every time you visit. Savour fine flavours at
our awarded Point Revolving Restaurant, along with casual dining options.
To ensure we provide the best experience for your group, please note that bookings must be made at
least 7 days in advance.
Considering on the integration of software technologies at Wrest Point Casino, it’s important to note that the establishment leverages cutting-edge systems across its gaming and operational
spectrum. For larger wins, arrangements can be made for alternative withdrawal
methods, such as bank transfers or checks, to ensure the safety and convenience of the transaction. These cards provide a convenient and secure way to manage expenses, catering to a broad range of customers with different preferences.
At Wrest Point Casino, transactions for gaming, purchases, and
accommodations are primarily conducted in person.
References:
https://blackcoin.co/casino-rocket-australia-your-next-favourite-online-spot/
He blends his teaching experience with digital tools to make
learning accessible to a global audience. Important is a useful word, but it is broad.
When you match the synonym to the reason, your English sounds clearer.
Use serious when you want to show gravity or risk, and
important when you want to show value or priority.
English dictionary and learning for Spanish speakers Stronger, more descriptive
words are just a double click away! LanguageTool’s synonym function is user-friendly and intuitive.
The word important has a few other word forms.
References:
https://blackcoin.co/las-vegas-a-comprehensive-guide/
australian online casinos that accept paypal
References:
http://www.smilecarexport.com
paypal casino
References:
https://hyungwoo.com/bbs/board.php?bo_table=free&wr_id=2524
online pokies australia paypal
References:
http://www.sunti-apairach.com/nakhonchum1/index.php?name=webboard&file=read&id=1064728
online casino australia paypal
References:
https://carrieresecurite.fr/entreprises/online-casino-mit-paypal-einzahlung-die-top-casinos-im-vergleich/
online slots paypal
References:
https://casjobs.in/employer/online-casinos-australia-best-aussie-casino-sites-of-2025/
online american casinos that accept paypal
References:
https://fanajobs.com/profile/trey9506756375