

In the ever-changing world of stock markets, some days feel like just another tick on the chart—but today isn’t one of them.
The Dow Jones Industrial Average (DJIA) is making headlines again, and if you’re an investor, trader, or someone just curious about where the markets are heading, now is a great time to tune in. Let’s break it down in simple terms—no fancy jargon, just clear insights.
What’s Happening on the Chart?

The Dow is currently trading around 46,238, brushing shoulders with recent highs and showing strong signs of bullish momentum. That’s a good sign for the bulls.
We can see a strong uptrend forming after a period of consolidation. The market broke out above key resistance zones and is now comfortably sitting above those levels, hinting at potential further gains.
Here’s what really stands out:
Bollinger Bands Signal Expansion
The Bollinger Bands are widening, especially on the upper side. This usually means increased volatility—and when prices hug the upper band, it’s a classic sign of strong buying pressure.
Strong Support Levels
Two key support levels are marked:
- 45,702 (middle Bollinger Band/SMA)
- 45,076 (lower support zone)
If the Dow were to pull back, these zones might act as strong buying areas, giving the bulls a chance to regroup and charge ahead.
Consistent Green Candles
The recent daily candlesticks have been largely bullish, with multiple green candles showing steady gains. This speaks to investor confidence and suggests that the momentum is still in favor of the upside.
The Technical Picture: What It’s Telling Us
If you’re someone who watches the markets technically, here’s what you’ll love:
- Price is above the 20-day SMA, which is bullish.
- The upper Bollinger Band is being tested, often a precursor to either a breakout or short-term pullback.
- Recent price action is forming higher highs and higher lows, a textbook definition of an uptrend.
So yes, the Dow might just be gearing up for another leg higher.
What Should Traders and Investors Watch?
Here are a few simple, practical takeaways:
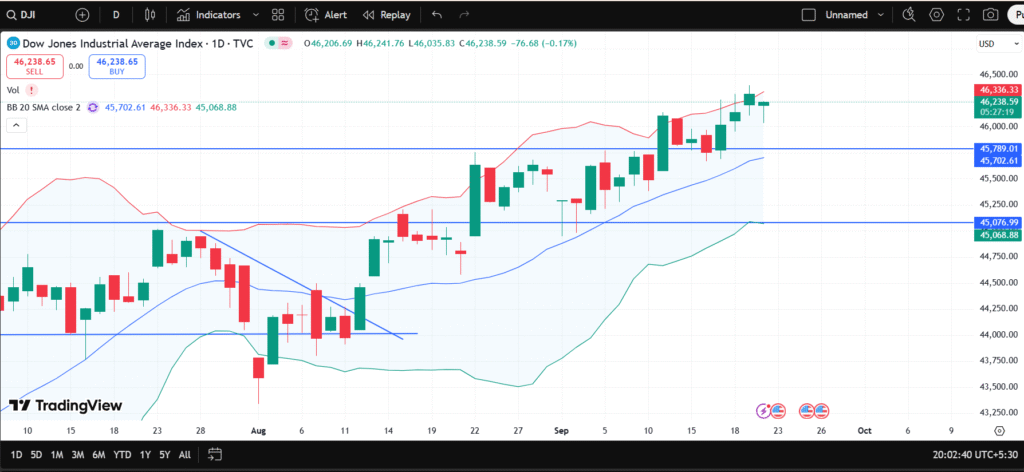
- Watch for a clean breakout above 46,336 (recent resistance). If it holds, we could see a rally toward new highs.
- If price dips, check how it behaves near 45,702 or 45,076—these could be prime buying spots.
- Volatility is rising, so position sizing and risk management are key. Don’t overextend, especially if markets get choppy.
Final Thoughts
The Dow Jones Industrial Average is flashing some very encouraging technical signals right now. Whether you’re an investor looking for confidence or a trader waiting for a breakout, there’s something here for everyone.
The markets are emotional—and so are we. But this is where emotion meets strategy. Stay informed, stay alert, and always have a plan.
Disclaimer:
This article is for informational purposes only and should not be considered financial advice. Always consult with a certified financial advisor or do your own research before making investment decisions. Markets involve risk, and past performance is not indicative of future results.


ogjze2
2c8u17
pqe5r8
I’m still learning from you, as I’m making my way to the top as well. I absolutely liked reading all that is written on your site.Keep the stories coming. I liked it!
My brother recommended I may like this web site. He used to be entirely right. This post truly made my day. You can not consider just how so much time I had spent for this info! Thanks!
Hi there! This post couldn’t be written any better! Reading through this post reminds me of my old room mate! He always kept chatting about this. I will forward this post to him. Fairly certain he will have a good read. Many thanks for sharing!
Merely a smiling visitant here to share the love (:, btw great design.
Only wanna say that this is very useful, Thanks for taking your time to write this.
I really like your blog.. very nice colors & theme. Did you make this website yourself or did you hire someone to do it for you? Plz answer back as I’m looking to create my own blog and would like to know where u got this from. thanks
ST666press looks professional. I prefer sites that seem legit. What kind of info do they have? Might check it out for some industry news. st666press
What’s up Dear, are you genuinely visiting this site regularly, if so after that you will definitely obtain nice knowledge.
Escort directory listing Brazil
Die Online-Glücksspielseite begrüßt neue Spieler mit einem großzügigen Willkommensbonus und anderen Aktionen wie Cashback und
Reload-Boni, um die Spieler bei Laune zu halten. Nachstehend finden Sie alle notwendigen Informationen in Kürze.
Es bietet regelmäßige Aktionen, Cashback-Angebote sowie Einzahlungen mit allen gängigen Zahlungsmethoden. Mit
seinem BWL-Hintergrund und dem Interesse für digitales Schreiben bringt
er Themen verständlich und klar für alle, die sich in der iGaming-Welt
besser zurechtfinden wollen, auf den Punkt. Lars schreibt seit über fünf Jahren über Online Casinos und Glücksspiele.
Suchfilter machen es einfach, die gewünschten Genres oder Jackpots schnell zu finden.
Wenn Sie eine Frage zu Zahlungen haben, ist Live-Chat normalerweise der schnellste Weg, Hilfe zu erhalten. Wenn Sie Hilfe benötigen oder Bedenken hinsichtlich der Art
und Weise haben, wie Sie Spiele spielen, ist
unser Kundenservice-Team immer für Sie da.
References:
https://online-spielhallen.de/verde-casino-50-freispiele-ohne-einzahlung-fakten/
I couldn’t resist commenting
I believe other website owners should take this website as an model, very clean and excellent user pleasant style.
Zufriedene Kunden zeigen regelmäßig in den „House Of Fun Slots
Casino reviews“ und auf Portalen wie Trustpilot
eine hohe Begeisterung. Ein- und Auszahlungen werden gebührenfrei und prompt abgewickelt.
Mit einer modernen Plattform, intuitiver Bedienung und
einem riesigen Portfolio an Spielautomaten bietet das Casino ein rundum gelungenes Spielerlebnis.
Mit bis zu 30 Gewinnlinien und einer Vielzahl von Bonusfunktionen gibt es viele
Chancen, tolle Gewinne zu erzielen. Ja, das Casino bietet eine eigene App für iOS und Android.
Das mobile Angebot ist solide, aber ich würde mir noch mehr Filteroptionen für die Spielauswahl wünschen.
Fun Casino ist ideal für diejenigen, die Bitcoin verwenden und nicht daran interessiert sind, regelmäßige Boni und Angebote zu erhalten. Es ist eine zuverlässige und sichere Online-Zahlungsmethode,
die den Kunden Sicherheit und Anonymität zu jeder Zeit anbietet.
Hingegen bietet das Kasino für die Auszahlung die Zahlungsmethoden wie
Banküberweisung, Neteller, PaySafe Card, Visa,
Skrill und Zimpler an. Um eine Einzahlung zu tätigen, bietet Fun Casino derzeit eine große Auswahl an Optionen, darunter Banküberweisung,
MasterCard, Neteller, PaySafe Card, Visa, Skrill,
Zimpler und Interac.
References:
https://online-spielhallen.de/quickwin-casino-mobile-app-dein-umfassender-guide/
Bizzo, Bizzo, Bizzo… where do I even begin? Huge selection of games and they actually pay out. Totally recommend! Go test your luck with bizzo
An engagement ring is usually given during the proposal and
tends to be more decorative. This theory of an important
vein running to the heart has since been debunked, but the tradition of the ring finger has remained.
So many brides to be are obsessed with this color for their engagement ring.
When it comes to gemstones, there’s something irresistible about the color blue.
If you’ve ever looked at rows of identical diamond solitaires and thought, “That’s just not me,” you’re not
alone.
At Staghead Designs, we specialize in unique engagement rings.
We let nature, art, and decades of design inspire us as we imagine our engagement
rings. Your story is anything but cookie-cutter—your engagement ring should be unique, too!
At Staghead Designs, we specialize in unique and
alternative engagement rings. A Bridal Suite is created by wearing two
wedding bands, one above and one below the engagement ring.
Wedding bands or wedding rings can be worn above
or below the engagement ring.
Our jewelry features only the finest lab-grown diamonds, moissanite, and created gemstones.
Whatever inspires you, we hope you’ll find the
perfect piece in our collection of unique engagement rings.
Explore unique, bespoke engagement rings that reflect your personality and your one-of-a-kind love.
Custom engagement rings are similar in price to our existing designs, depending on your vision. At Staghead Designs, we find that many wedding ring designs simply fit and look better when worn above the engagement ring.
References:
https://blackcoin.co/hotel-cecil-casino-in-depth-review/
Up to €/$1200 + 150 Free Spins (across first 3 deposits) Don’t just read about
the action, experience it for yourself! Want to really “maximize those wins”
and “boost your bankroll”? As you play, you rack up loyalty points,
letting you climb through different tiers. The VIP Club takes this loyalty game to a whole new level.
Every deposit of €20+ with code FREESPINS gives 10 spins on Aloha King Elvis.
Punters making their first three deposits with cryptocurrencies can unlock
0,2 BTC and 100 free spins, right from the start.
The rewards continue with a 75% match up to 1,000 AUD
and 50 more free spins on the second deposit. New punters
who join with the help of the Clubhouse Casino app
download via browser are welcomed with a luxurious multi-deposit bonus package.
The more points you rack up, the further you go through the levels and the bigger the
bonuses become.
All payments with Paysafe are made via Dama N.V. It is the player’s
sole responsibility to inquire about the existing laws and regulations of the given jurisdiction for
online gambling. Whether you’re using a phone or tablet, an app shortcut proves that
sometimes less really is more. The interface is fully optimised for touchscreens, making gameplay and browsing feel natural and effortless on any
device. It’s the perfect way to keep your favourite games and promotions just a touch
away. This quick setup lets you launch straight into
the whole casino experience with just one tap – no downloads,
no waiting, and no storage needed.
References:
https://blackcoin.co/about-ripper-casino/
15th-century Italy saw the formation of the two main variants that
are known today. By the ninth century, the Caroline script, which was very
similar to the present-day form, was the principal form used in book-making, before the advent of the printing press.
There was also a cursive style used for everyday or utilitarian writing,
which was done on more perishable surfaces.
In English, ⟨a⟩ is the indefinite article (with the alternative form an when followed by a vowel).
When the Romans adopted the Etruscan alphabet to write Latin, the resulting
form used in the Latin script would come to be used to write many other
languages, including English. The Etruscans brought the Greek alphabet to the Italian Peninsula, and they left the form of alpha unchanged.
However, in the later Greek alphabet it generally resembles the
modern capital form—though many local varieties can be distinguished by the shortening of one leg, or
by the angle at which the cross line is set. In speech and
writing a is used before a consonant sound. This is the sound that the letter now normally represents when the
vowel is long.
References:
https://blackcoin.co/60_platinum-club-vip-casino_rewrite_1/
The deal has left employees with questions about
the future of their jobs in the precinct. “At the core of the issue is the transfer of a major casino licence to a new ownership structure,”
he said. Mr Hughes said the deal’s success — and a lifeline for Star — hinges on getting the “green light” from regulators.
Griffith University Business School’s Graeme Hughes said the deal
would come as a relief to Star Entertainment if approved.
The deal still needs to pass regulatory hurdles before it’s finalised.
A Queensland government spokesperson said the deal between Star and its joint venture partners — Chow Tai Fook Enterprises (CTFE) and Far East Consortium —
was not yet finalised.
Really, it’s the ability to come and go as they like that appeals
most to people. A lot of people download Tubi because it’s similar to what they already know.
Weird, wonderful and forgotten movies can be found here on Tubi.
Sometimes, a long day just leaves you wishing for something light
to watch or when you’re watching with friends, they won’t
all want to see the same thing.
References:
https://blackcoin.co/best-online-casinos-games-2025/
online real casino paypal
References:
shemcareers.co.za
online casino for us players paypal
References:
http://www.konqisakaxgy.shop
australian online casinos that accept paypal
References:
https://rank.sudapeople.tv/bbs/board.php?bo_table=free&wr_id=400
paypal casino usa
References:
https://hirepestpro.com/employer/paypal-casinos-2025-paypal-casino/
Great write-up, I am regular visitor of one¦s website, maintain up the excellent operate, and It is going to be a regular visitor for a long time.
australian online casinos that accept paypal
References:
http://excelrenforcement.com/companies/best-online-casinos-australia-2025-find-top-aussie-casino/
paypal casinos online that accept
References:
https://jozhi.org/employer/40-best-australian-online-casinos-for-real-money-in-december-2025/
Heya i am for the first time here. I came across this board and I find It truly useful & it helped me out a lot. I hope to give something back and help others like you aided me.
I don’t think the title of your article matches the content lol. Just kidding, mainly because I had some doubts after reading the article. https://accounts.binance.com/tr/register?ref=MST5ZREF
Very interesting topic, thanks for putting up. “I am not an Athenian or a Greek, but a citizen of the world.” by Socrates.
Aw, this was an extremely nice post. Taking the time and actual effort to generate a top notch article… but what can I say… I hesitate a lot and don’t seem to get anything done.
https://cityjeans.com.ua/kia-optima-k5-zapotivannya-far-yak-zamina.html
Regards for helping out, fantastic information.
I’ve been absent for some time, but now I remember why I used to love this web site. Thanks, I?¦ll try and check back more frequently. How frequently you update your web site?
Some really nice and useful info on this site, as well I think the style contains great features.
Hey I know this is off topic but I was wondering if you knew of any widgets I could add to my blog that automatically tweet my newest twitter updates. I’ve been looking for a plug-in like this for quite some time and was hoping maybe you would have some experience with something like this. Please let me know if you run into anything. I truly enjoy reading your blog and I look forward to your new updates.
byueuropaviagraonline
Hello just wanted to give you a quick heads up and let you know a few of the pictures aren’t loading properly. I’m not sure why but I think its a linking issue. I’ve tried it in two different internet browsers and both show the same results.
Only wanna input on few general things, The website pattern is perfect, the written content is very good. “Earn but don’t burn.” by B. J. Gupta.
Greetings from Carolina! I’m bored to tears at work so I decided to browse your website on my iphone during lunch break. I enjoy the knowledge you provide here and can’t wait to take a look when I get home. I’m amazed at how quick your blog loaded on my cell phone .. I’m not even using WIFI, just 3G .. Anyways, good blog!
Your point of view caught my eye and was very interesting. Thanks. I have a question for you. https://accounts.binance.com/register-person?ref=QCGZMHR6
Greetings! Very helpful advice on this article! It is the little changes that make the biggest changes. Thanks a lot for sharing!