

Bitcoin (BTC/USD) has entered a tight consolidation zone, forming a symmetrical triangle on the daily chart — signaling a potential major breakout or breakdown. With narrowing Bollinger Bands and relatively low volume, market participants are on high alert for a volatile move in the coming days.
Here’s a comprehensive technical analysis of BTC/USD based on the latest chart patterns.
📊 Chart Overview – BTC/USD (Daily)
| Parameter | Value |
|---|---|
| Current Price | $108,753.55 |
| Day’s High | $109,745.66 |
| Day’s Low | $108,719.34 |
| 20-SMA (Mid Bollinger Band) | $106,540.58 |
| Upper Bollinger Band | $111,148.72 |
| Lower Bollinger Band | $101,932.44 |
| Volume | 1.59K |
🔺 Triangle Formation Signals Imminent Move
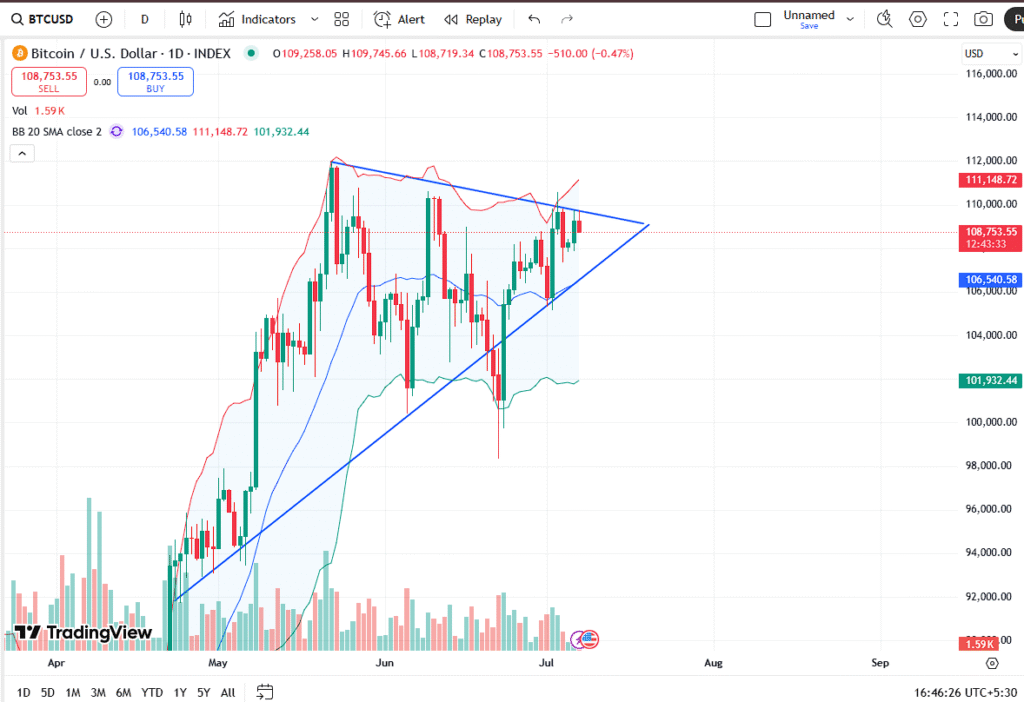
The chart clearly shows a symmetrical triangle pattern — characterized by:
- Higher lows supported by an ascending trendline from April
- Lower highs indicating selling pressure near $111K
Bitcoin is nearing the apex of the triangle, which often precedes a strong breakout in either direction.
🔍 Technical Analysis Breakdown
🔼 Bullish Breakout Scenario:
- Break and close above $111,150 (upper triangle + Bollinger resistance)
- Possible surge toward $115,000–$118,000
- Must be supported by volume > 2K and bullish candle confirmation
🔽 Bearish Breakdown Scenario:
- Breakdown below $106,500 trendline support
- May revisit key levels at $103,000 and $101,000
- Next major support at the lower Bollinger Band near $101,900
📌 Key Support & Resistance Levels
| Type | Price Level (USD) |
|---|---|
| Immediate Resistance | $111,150 |
| Triangle Resistance | $110,800–$111,000 |
| Trendline Support | $106,500 |
| Major Support | $101,900 |
| Psychological Barrier | $100,000 |
💡 Trading Strategy
📈 For Bullish Traders:
- Watch for breakout above $111,200
- Confirm with strong bullish candle + volume
- Target: $115K–$118K
- Stop-loss: Below $106,500
📉 For Bearish Traders:
- Breakdown below ascending support line
- Confirm with volume spike and close below $106K
- Target: $103K–$101K
- Stop-loss: Above $111K
🧠 What Do Bollinger Bands Indicate?
- Bands are narrowing, indicating low volatility
- Price is hugging the midline (SMA 20)
- A breakout beyond either band could be explosive
This aligns with previous triangle breakout behavior seen in March and May 2024, where consolidation led to high-momentum directional moves.
🔗 Internal Reference
👉 Also Read: Bitcoin Weekly Analysis: Top Patterns Traders Must Watch in July 2025
⚠️ Disclaimer
This analysis is for educational and informational purposes only and does not constitute financial advice. Cryptocurrencies are highly volatile and risky. Always consult with a financial advisor before investing. Trading decisions should be based on personal risk tolerance and thorough market research.


Gavuitv, I’ve heard that it’s good for streaming stuff. Gonna check it out myself. I’m bored you know. You should also check it out here gavuitv
Shensb88, saw this ad pop up the other day. Looks interesting. Debating whether to sign up. What do you all think? Maybe I will check it out here shensb88
36jililogin, keeps popping into my head! Thinking I’ll give it a try later. Maybe it will be a great experience! Maybe you’ll also thinking the same after checking it here 36jililogin
Your article helped me a lot, is there any more related content? Thanks!
Thank you for your sharing. I am worried that I lack creative ideas. It is your article that makes me full of hope. Thank you. But, I have a question, can you help me?
Thanks for sharing. I read many of your blog posts, cool, your blog is very good.
Thank you for your sharing. I am worried that I lack creative ideas. It is your article that makes me full of hope. Thank you. But, I have a question, can you help me? https://www.binance.com/de-CH/register?ref=W0BCQMF1