

Introduction
Bitcoin (BTC) is witnessing heightened volatility as it hovers around the $115,000 mark, a key psychological level for traders and investors. After a sharp rally earlier this month, BTC now faces resistance at $117,000 while maintaining support near $112,000. The cryptocurrency market is at a crucial juncture, with investors closely watching whether Bitcoin can break above its current ceiling or retrace towards lower support zones. This article provides an in-depth look at the latest BTC/USD trends, technical indicators, and market sentiment, highlighting what could shape the digital asset’s trajectory in the coming weeks.
Bitcoin Price Action Shows Signs of Consolidation
Bitcoin’s recent movement suggests a consolidation phase after testing the $117,364 resistance level, which aligns with the upper Bollinger Band on the daily chart. On September 13–15, BTC briefly touched $116,000 before retracing slightly, closing near $115,003. The candlestick patterns over the last few sessions indicate indecision, with bulls attempting to push higher but facing strong selling pressure near $117K.
The 20-day Simple Moving Average (SMA) stands at $112,202, offering near-term support, while the 50-day SMA is trending lower but catching up with the rally. A break above $117,500 could trigger another bullish run toward $120,000 and beyond. However, failure to hold above $115,000 might invite fresh selling, potentially dragging BTC back to $112,000 or even $107,500, a strong historical support level.
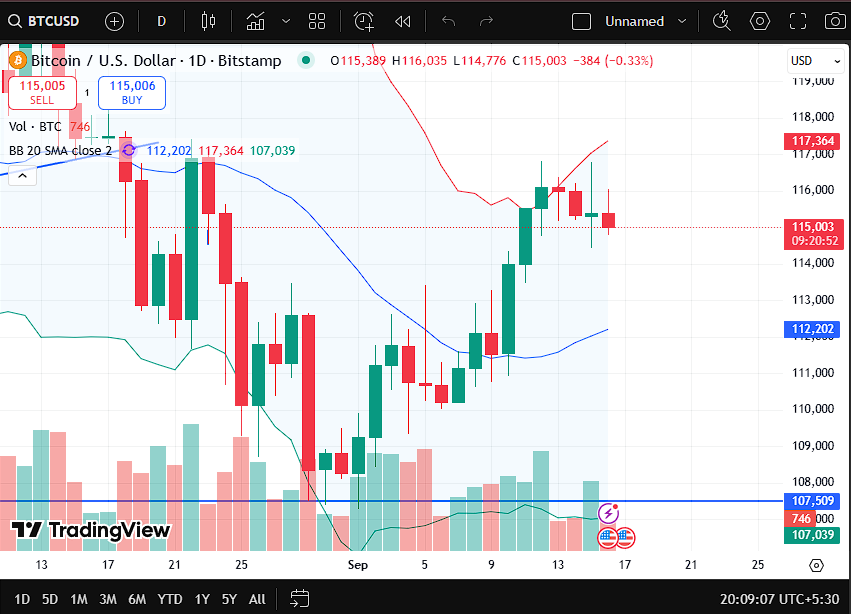
Caption suggestion: Bitcoin (BTC/USD) faces resistance near $117,000 while consolidating around $115,000.
Key Technical Insights and Market Indicators
The Bollinger Bands, which currently show the upper limit near $117,364 and the lower band at $107,039, highlight Bitcoin’s current volatility. The narrowing bands compared to early September suggest reduced price swings, pointing toward consolidation before a potential breakout.
Volume analysis also indicates waning momentum, with recent sessions showing declining trading volumes compared to the earlier bullish surge. Typically, this means traders are waiting for a decisive move before committing to new positions.
According to market analysts, Bitcoin’s ability to sustain above $115,000 is critical. A well-known crypto strategist recently commented:
“BTC’s short-term path is determined by whether it can defend $115K convincingly. If the bulls fail here, we could see a swift test of $112K support.”
Historically, September has been a volatile month for Bitcoin, often marked by profit-taking and sideways action before October ushers in stronger bullish trends. Long-term investors remain confident, but short-term traders are exercising caution.
Institutional Demand and Macro Factors Drive Sentiment
Beyond technical indicators, Bitcoin’s price is increasingly tied to broader macroeconomic trends and institutional involvement. With global equity markets stabilizing after recent volatility, digital assets like Bitcoin are once again in focus as a hedge against inflation and currency devaluation.
Major institutions have been slowly increasing their exposure. Reports suggest that asset managers are allocating small but growing percentages of their portfolios to Bitcoin ETFs, contributing to liquidity and stability. Meanwhile, macroeconomic factors such as U.S. Federal Reserve rate-cut expectations continue to play a pivotal role in shaping sentiment.
At the same time, Bitcoin mining activity remains strong, with hash rates reaching near-record highs. This signals confidence from miners despite recent corrections. Historically, robust network fundamentals often precede long-term bullish rallies.
Analysts also highlight that geopolitical tensions and currency weakness in some emerging markets are pushing investors toward Bitcoin as a “digital gold.” As such, even if short-term price action remains choppy, the underlying demand narrative continues to build.
Future Outlook: Bullish Breakout or Deeper Correction?
Looking ahead, Bitcoin’s next major move hinges on whether it can decisively clear the $117,500 resistance level. If successful, the momentum could quickly carry BTC to $120,000 and potentially $125,000, which would represent fresh highs in the current cycle.
On the flip side, a failure to defend $115,000 may see Bitcoin testing the $112,000 support, with further downside risk toward $107,500. Traders are closely monitoring the daily close levels to gauge strength.
From a long-term perspective, Bitcoin remains in a strong uptrend. The higher-lows pattern formed since late August reflects accumulating demand. Additionally, the broader adoption of Bitcoin ETFs, regulatory clarity in the U.S., and increasing global demand provide strong fundamental support for future price growth.
Conclusion
Bitcoin’s price action near $115,000 is shaping up to be a defining moment for the cryptocurrency market this September. While short-term volatility is likely to continue, the long-term trend remains constructive. Traders must watch the $117,500 resistance and $112,000 support closely as Bitcoin prepares for its next major move. Whether it breaks higher or corrects lower, the outcome will set the tone for Q4 2025.
Disclaimer: This article is for informational purposes only and does not constitute financial advice. Cryptocurrency investments are highly volatile and carry significant risks. Investors should conduct their own research or consult a financial advisor before making decisions.


30zkw8
You haven’t checked out phdream333? Dude this game is amazing and you won’t regret playing. Do check out the link! phdream333
Zudem bekommt ihr häufig Freispiele für beliebte Automatenspiele dazu.
Durch die große Konkurrenz sind die Willkommensboni vielfältig und ihr könnt auch mehrere Angebote annehmen. Mit diesen Angeboten wollen die
Anbieter uns ihr Casino online schmackhaft machen. Ein weiterer Vorteil in Deutschen Casinos online
ist, dass ihr eine schier unendliche Auswahl an Live Tischen vorfindet.
Mit der Einführung des Live Casinos kommt das Spielcasino zu euch nach Hause.
Mit traditionellen Zahlungsmethoden und Kryptowährungen bietet das Casino
flexible Zahlungsoptionen für alle Spieler. Ricky Casino sticht durch seine attraktiven Bonusangebote und eine beeindruckende
Spieleauswahl hervor. Zudem ist die Webseite von North Casino sowohl auf Desktop- als auch auf
Mobilgeräten leicht zu navigieren, was die Benutzerfreundlichkeit
weiter erhöht.
Tisch- und Live Casino Spiele sowie progressive Jackpot Automaten würden normalerweise das Angebot bereichern, bieten sie doch strategische Tiefe und zusätzlichen Nervenkitzel.
Alle Casinos verfügen über eine gültige deutsche GGL-Lizenz und stehen für Sicherheit,
Fairness und höchste Qualität. Nur Online Casinos mit
deutscher GGL-Lizenz werden überhaupt berücksichtigt.
Ein Online Casino wird von uns nur dann empfohlen, wenn es über die erforderliche deutsche GGL-Lizenz verfügt.
References:
https://online-spielhallen.de/n1bet-casino-promo-code-ihr-leitfaden-zum-gewinnen/
123wincom30? Another one bites the dust… or maybe not! Worth a quick look at least. Are their bonuses any good tho’? I wonder. 123wincom30
This setup appeals to players who value speed, privacy,
and innovative gaming technology while playing on the go.
Handy filters let users sort games by theme, volatility, or provider, making it easy to
find the right pokies for any bankroll. Popular hits such as
Gates of Olympus, Big Bass Bonanza, and Book of Dead remain favourites among Aussie
players for their high RTP rates and engaging bonus features.
All bonuses include clear wagering rules visible in your account
dashboard, ensuring transparent play and easy progress tracking.
The live casino, powered by Evolution, Lucky Streak, and Pragmatic Play, brings real
casino action straight to your screen. Popular developers like NetEnt, Microgaming, BGaming, Pragmatic Play,
and Evolution ensure players always find new releases and trusted favorites.
The slot collection covers everything from classic three-reel
games to modern video slots with jackpots, bonus features, and innovative mechanics.
Step into Rocketplay Casino – one of Australia’s top destinations
for online gambling. Every level offers benefits and awards that are intended
to improve your game experience.
References:
https://blackcoin.co/welcome-to-vegasnow-casino-australia-in-depth-review/
With over 7,000 games and a fast 10-minute payout time, Skycrown delivers top-notch entertainment for Aussies eager to explore.
Offers competitive bonuses and lightning-fast cryptocurrency payouts.
Access your favorite games, manage your funds, and claim bonuses
with just a few taps. Playing pokies, table games, or live dealer sessions is a form of entertainment, not a guaranteed path to profit.
A good casino responds fast, solves issues clearly, and provides
transparent bonus terms.
Here you’ll find a broad mix of real-money pokies, live dealer tables, and modern gaming tools that make play smooth on both desktop
and mobile. Responsible gaming ensures that pokies, live tables, and
other casino games remain enjoyable instead of stressful.
For Australians, choosing the right online casino comes down to licensing,
AUD-friendly payments, pokies variety, and fast withdrawals.
With pokies, live dealer games, and even jackpots eligible for bonus play, SkyCrown Casino makes it easy to kickstart your journey with extra confidence.
The SkyCrown mobile app-style site delivers the same range of pokies
and bonuses as the desktop version.
References:
https://blackcoin.co/about-ripper-casino/
online casinos mit paypal
References:
okbolt.co.kr
australian online casinos that accept paypal
References:
https://backtowork.gr/employer/best-online-casinos-in-australia-top-casino-sites-for-2025/
online poker real money paypal
References:
https://workmall.uz/en/employer/best-online-casinos-australia-top-10-australian-casinos-2025/
online poker real money paypal
References:
http://geokofola.geopivko.cz/forum/profile/ionarussell5116/
Thank you for your sharing. I am worried that I lack creative ideas. It is your article that makes me full of hope. Thank you. But, I have a question, can you help me?
Продолжительность процедуры — от 40 минут до полутора часов. Уже в первые часы после начала терапии состояние пациента значительно улучшается: проходит тошнота, снижается тревожность, восстанавливается координация движений.
Исследовать вопрос подробнее – наркология вывод из запоя тольятти
Вывод из запоя в Тюмени — это медицинская процедура, направленная на устранение алкогольной интоксикации и восстановление нормального функционирования организма. Длительное употребление спиртных напитков приводит к нарушению обмена веществ, обезвоживанию, сбоям в работе печени и сердца. В таких случаях требуется профессиональная помощь врача-нарколога, который подберёт оптимальный способ дезинтоксикации и медикаментозной поддержки. Современные методики позволяют провести вывод из запоя безопасно, эффективно и без осложнений.
Разобраться лучше – вывод из запоя на дому
Thanks for sharing. I read many of your blog posts, cool, your blog is very good.
**mitolyn**
Mitolyn is a carefully developed, plant-based formula created to help support metabolic efficiency and encourage healthy, lasting weight management.
Клиника «Трезвый Шаг Раменское» выстраивает помощь так, чтобы пациент и его близкие не метались между разными службами и частными «специалистами», а получали комплекс услуг в одном месте. Это особенно важно для тех, кто уже сталкивался с провалами после разовых кодировок, неподходящих капельниц или формальной «помощи».
Узнать больше – narkologicheskaya-klinika-ramenskoe10.ru/
**boostaro reviews**
Boostaro is a purpose-built wellness formula created for men who want to strengthen vitality, confidence, and everyday performance.
**prodentim reviews**
ProDentim is a distinctive oral-care formula that pairs targeted probiotics with plant-based ingredients to encourage strong teeth, comfortable gums, and reliably fresh breath
**herpafend**
Herpafend is a natural wellness formula developed for individuals experiencing symptoms related to the herpes simplex virus. It is designed to help reduce the intensity and frequency of flare-ups while supporting the bodys immune defenses.
**prostafense reviews**
ProstAfense is a premium, doctor-crafted supplement formulated to maintain optimal prostate function, enhance urinary performance, and support overall male wellness.
**neuro sharp**
Neuro Sharp is an advanced cognitive support formula designed to help you stay mentally sharp, focused, and confident throughout your day.
Критичные случаи, когда вызов нарколога через «МедТрезвие Долгопрудный» оправдан и своевременен:
Исследовать вопрос подробнее – нарколог на дом срочно
Выезд нарколога на дом в Серпухове — это возможность получить профессиональную помощь в условиях, когда везти человека в клинику сложно, опасно или он категорически отказывается от госпитализации. Специалисты «СерпуховТрезвие» работают круглосуточно, приезжают по адресу с одноразовыми системами, стерильными расходниками и необходимым набором препаратов, проводят осмотр, оценивают жизненно важные показатели, подбирают индивидуальную капельницу, контролируют реакцию и оставляют подробные рекомендации. Всё происходит конфиденциально, без лишних свидетелей, без осуждения и давления. Цель — не формально «поставить капельницу», а безопасно стабилизировать состояние, снизить интоксикацию, выровнять давление и пульс, уменьшить тревогу и вернуть человеку возможность нормально спать и восстанавливаться, не доводя до осложнений и экстренной госпитализации.
Детальнее – вызов врача нарколога на дом
Hiya, I am really glad I have found this info. Nowadays bloggers publish only about gossips and internet and this is really frustrating. A good website with exciting content, this is what I need. Thanks for keeping this site, I will be visiting it. Do you do newsletters? Cant find it.
Hey! Do you know if they make any plugins to protect against hackers? I’m kinda paranoid about losing everything I’ve worked hard on. Any tips?
4wtbci
I have been exploring for a bit for any high-quality articles or weblog posts in this sort of area . Exploring in Yahoo I at last stumbled upon this site. Studying this info So i am happy to express that I’ve an incredibly excellent uncanny feeling I found out just what I needed. I such a lot unquestionably will make sure to do not disregard this web site and give it a look regularly.
Okay, so I stumbled upon mexok the other day and honestly, it’s pretty decent! The interface is clean and easy to navigate. Definitely worth checking out if you’re looking for something new! Check it out yourself mexok.
¡Amo Deportes Caliente! Siempre tienen los eventos que me interesan y las cuotas están de lujo. Recomendadísimo para los que aman el deporte y las apuestas deportes caliente
80jili? Yeah man, it’s legit. Games are fun, and I haven’t had any issues so far. Give it a shot if you’re looking for something new! Link here: 80jili
Good day! I know this is kind of off topic but I was wondering which blog platform are you using for this website? I’m getting fed up of WordPress because I’ve had problems with hackers and I’m looking at alternatives for another platform. I would be awesome if you could point me in the direction of a good platform.
Wonderful work! This is the type of information that should be shared around the web. Shame on Google for not positioning this post higher! Come on over and visit my site . Thanks =)
hello there and thank you for your info – I have definitely picked up anything new from right here. I did however expertise several technical points using this web site, as I experienced to reload the site a lot of times previous to I could get it to load properly. I had been wondering if your web host is OK? Not that I am complaining, but sluggish loading instances times will often affect your placement in google and can damage your quality score if ads and marketing with Adwords. Well I’m adding this RSS to my email and can look out for much more of your respective interesting content. Ensure that you update this again soon..
Definitely believe that which you said. Your favorite justification seemed to be on the net the easiest thing to be aware of. I say to you, I definitely get irked while people think about worries that they plainly do not know about. You managed to hit the nail upon the top and defined out the whole thing without having side effect , people can take a signal. Will probably be back to get more. Thanks
This is very interesting, You’re a very professional blogger. I’ve joined your rss feed and stay up for seeking extra of your fantastic post. Also, I’ve shared your website in my social networks!
so much good information on here, :D.
Very interesting details you have noted, thanks for putting up.
I do not even understand how I stopped up here, but I assumed this submit used to be good. I do not understand who you might be however certainly you are going to a famous blogger in case you aren’t already 😉 Cheers!
What’s Happening i am new to this, I stumbled upon this I’ve found It positively helpful and it has helped me out loads. I hope to contribute & aid other users like its helped me. Great job.
Just wish to say your article is as astounding. The clearness in your post is just excellent and i can assume you’re an expert on this subject. Well with your permission let me to grab your RSS feed to keep updated with forthcoming post. Thanks a million and please keep up the enjoyable work.
Magnificent web site. A lot of useful info here. I am sending it to a few friends ans also sharing in delicious. And of course, thanks for your effort!
I together with my pals happened to be following the great items found on your site and the sudden got a horrible feeling I had not expressed respect to the site owner for those techniques. These men had been absolutely glad to read through them and have in effect in fact been taking advantage of these things. Thanks for indeed being quite helpful and for considering this kind of perfect areas millions of individuals are really eager to learn about. My very own sincere apologies for not expressing appreciation to you earlier.
I would like to point out my passion for your kindness in support of those people who have the need for help on that topic. Your personal commitment to getting the message all-around had become quite important and has usually empowered guys and women much like me to get to their targets. This warm and helpful key points indicates a lot a person like me and much more to my mates. Thanks a ton; from everyone of us.
Awsome post and right to the point. I don’t know if this is actually the best place to ask but do you people have any thoughts on where to get some professional writers? Thank you 🙂
Lagi asik hunting j@ckp0t receh di Megabet808 asik.
I love studying and I conceive this website got some truly utilitarian stuff on it! .
You have brought up a very great details , appreciate it for the post.
Megabet808 emang jamu paling mujarab pas lagi $tr3$.
Wonderful blog! I found it while searching on Yahoo News. Do you have any suggestions on how to get listed in Yahoo News? I’ve been trying for a while but I never seem to get there! Cheers
Setiap klik di Xtraplay88 berasa ada harapan baru.
Aight, 77ph1… It’s got some bangers. Definitely worth a look if you’re tryna chill. Check it out: 77ph1
Need the Betano app on your iPhone? This is where you find it. Smooth install and you’re golden: betano app iphone
X777gamelogin – fast and simple access to your games. No messing around, just straight to the action: x777gamelogin
The following time I learn a weblog, I hope that it doesnt disappoint me as much as this one. I imply, I do know it was my option to read, but I actually thought youd have something fascinating to say. All I hear is a bunch of whining about something that you could possibly fix should you werent too busy on the lookout for attention.
obviously like your web site but you need to check the spelling on several of your posts. Several of them are rife with spelling issues and I find it very bothersome to tell the truth nevertheless I will definitely come back again.
I used to be suggested this web site by way of my cousin. I am no longer positive whether or not this put up is written by way of him as nobody else realize such special about my difficulty. You are wonderful! Thanks!
Very interesting information!Perfect just what I was looking for!
It’s the best time to make a few plans for the future and it is time to be happy. I’ve read this publish and if I could I desire to counsel you some attention-grabbing things or suggestions. Maybe you can write next articles regarding this article. I want to learn even more issues approximately it!
I carry on listening to the news broadcast lecture about getting free online grant applications so I have been looking around for the top site to get one. Could you advise me please, where could i find some?
very nice submit, i actually love this web site, keep on it
I really enjoy reading on this site, it holds fantastic blog posts. “The living is a species of the dead and not a very attractive one.” by Friedrich Wilhelm Nietzsche.
I am impressed with this internet site, real I am a big fan .
I went over this web site and I conceive you have a lot of excellent info, saved to fav (:.
Good website! I truly love how it is easy on my eyes and the data are well written. I am wondering how I could be notified when a new post has been made. I’ve subscribed to your RSS which must do the trick! Have a nice day!