
Introduction
The Dow Jones Industrial Average (DJIA) is once again at a crucial crossroads, and traders are watching every move closely. After a sharp decline from recent highs, the index is now attempting a recovery near critical support levels. But the big question remains—Is this the beginning of a new stock market rally, or just a temporary bounce before another fall?
This moment is important because it reflects the broader sentiment of the US stock market. With volatility rising and technical indicators flashing mixed signals, investors are trying to decode what comes next. In this article, we analyze the latest Dow Jones chart, key technical levels, and the overall market outlook.
Background: Why Dow Jones Is Facing Pressure After Recent Highs
The Dow Jones has experienced a strong upward trend over the past months, reaching near the 50,000 mark before facing resistance. Historically, such psychological levels often act as strong barriers where profit booking begins.
Looking at past trends, the DJIA tends to move in cycles—rallies followed by consolidation or correction. The recent decline from highs suggests that the market entered a correction phase, driven by selling pressure and cautious investor sentiment.
From a broader perspective, corrections are healthy for the market. They allow overvalued stocks to stabilize and create new entry opportunities. However, the current correction appears sharper than usual, indicating stronger selling momentum.
The index is now attempting to stabilize near support zones, which could determine the next big move. If buyers regain control, the Dow could recover. If not, further downside may follow.
Key Data & Statistics
- Current Price: Around 46,500 level
- Recent High: Near 50,000 resistance zone
- Key Resistance: 47,900 – 48,000 range
- Immediate Support: 45,700
- Strong Support: 45,000 – 45,100 zone
- Bollinger Bands: Price near lower band, indicating oversold conditions
- Trend: Short-term bearish, long-term still neutral
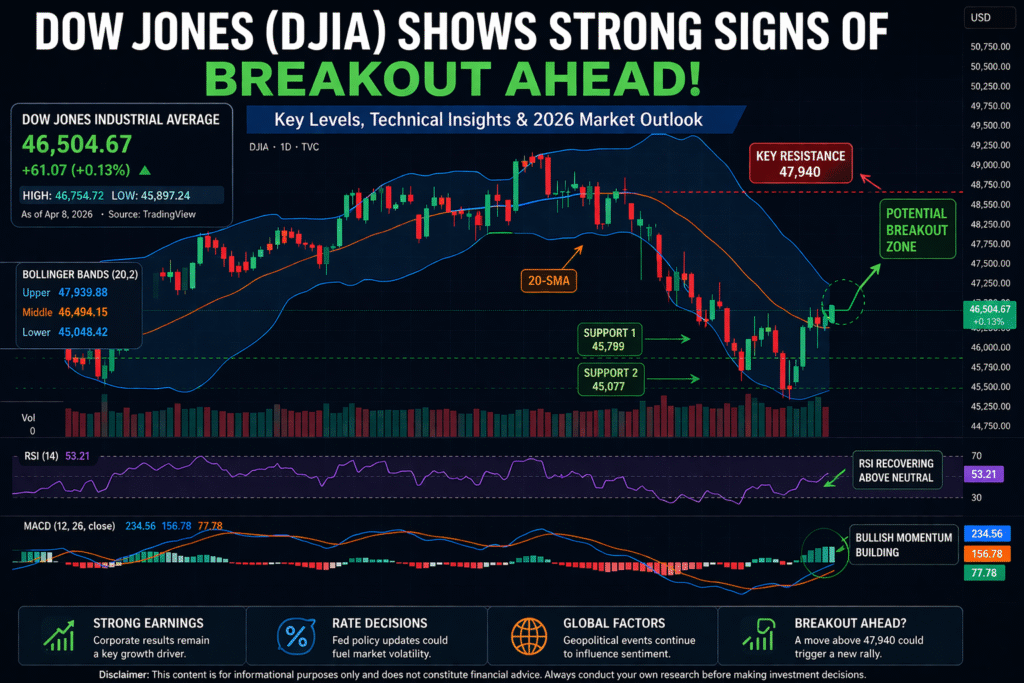
Dow Jones chart showing sharp correction, key support zones, and Bollinger Band positioning.
Current Market Developments: Why Dow Jones Is Volatile Right Now
The recent movement in the Dow Jones reflects uncertainty in the broader financial markets. After hitting highs, the index faced continuous selling pressure, forming a clear downtrend visible in the chart.
One of the most noticeable developments is the formation of consecutive red candles, showing strong bearish momentum. This indicates that sellers dominated the market for several sessions.
However, the latest candles suggest a possible recovery attempt. The index bounced from the 45,000 zone, which is acting as a strong support level. This indicates that buyers are stepping in at lower levels.
Another important observation is that the price is still trading below the moving average (blue line), which signals that the overall trend remains weak in the short term.
Market participants are currently cautious. Traders are waiting for confirmation before taking positions, while long-term investors are watching support levels for potential accumulation.
This phase of uncertainty often leads to sharp moves once a clear direction is established.
Technical & Fundamental Analysis: What the Chart Is Telling Us
The chart provides several important insights into the current state of the Dow Jones.
First, the Bollinger Bands show that the price recently touched the lower band. This usually indicates that the market is in an oversold condition. Such situations often lead to short-term rebounds.
Second, the moving average line is sloping downward, confirming bearish momentum. As long as the price remains below this level, upward moves may face resistance.
Third, the resistance zone around 47,900 is critical. The chart clearly shows that previous attempts to move higher were rejected near this level. This makes it a strong barrier for any bullish breakout.
On the downside, the 45,000 level is acting as a major support. The recent bounce from this area suggests that buyers are defending this zone aggressively.
From a technical standpoint, three scenarios emerge:
If the price breaks above 47,900 with strong volume, it could signal a bullish reversal and trigger a stock market rally.
If the price fails to cross resistance and falls below 45,000, it could lead to further downside, possibly testing lower levels.
If the price stays between these levels, the market may continue consolidating.
Fundamentally, the market is influenced by interest rate expectations, inflation concerns, and global economic conditions. These factors are adding to the uncertainty.
Risks and Challenges
- Strong resistance preventing upward movement
- Possibility of breakdown below key support
- High market volatility
- Uncertain global economic environment
- False recovery signals trapping traders
Expert Opinions & Market Sentiment
Market sentiment currently appears mixed. Short-term traders are cautious due to the recent downtrend, while long-term investors are looking for buying opportunities near support.
Institutional investors often wait for confirmation before entering the market. This is why volumes tend to increase near breakout or breakdown points.
There is also a noticeable shift toward defensive strategies. Investors are focusing more on risk management rather than aggressive buying.
Overall sentiment can be described as “wait and watch.” The market is not clearly bullish or bearish at this stage, making it a tricky environment for traders.
Future Outlook: What Traders Should Expect Next
Bullish Scenario
If the Dow Jones breaks above the 47,900 resistance level, it could attract strong buying interest. This may push the index toward higher levels and potentially restart the upward trend.
Bearish Scenario
If the price drops below 45,000, it could trigger panic selling. This may lead to a deeper correction and increase market volatility.
Neutral Scenario
If the index continues to trade between 45,000 and 47,900, the market may remain range-bound. This phase could continue until a strong trigger appears.
Overall, the market outlook remains uncertain but full of opportunities for those who understand key levels.
Conclusion: A Decisive Moment for Dow Jones
The Dow Jones is currently in a critical phase where both risk and opportunity exist. The chart clearly shows a battle between buyers and sellers at key levels.
For traders, this is a time to stay disciplined and follow technical signals closely. For investors, it may be a good opportunity to observe and plan rather than rush into decisions.
The next move will likely depend on whether the index breaks resistance or support. Until then, patience and careful analysis remain the best strategies.
If you found this analysis helpful, consider sharing it and exploring more insights on stock market trends and trading strategies.
Disclaimer
This article is for informational purposes only and should not be considered financial advice. Always do your own research before making any investment decisions.
Read more Articles Hindalco Industries in Spotlight: Is the Aluminium Cycle Turning in Its Favor?