

Introduction:
The Dow Jones Industrial Average (DJIA) entered the final week of July 2025 under pressure, failing to hold above its critical resistance near 45,200. Despite a robust rally earlier this month, the index closed lower on July 30, slipping below a key ascending trendline and signaling potential weakness ahead. Investors are now closely watching technical indicators and macroeconomic cues to assess whether this is a short-term correction or the beginning of a broader retracement. Here’s a breakdown of the latest chart behavior and what it means for market participants.
DJIA Faces Resistance at 45,200: Technical Breakdown Raises Caution
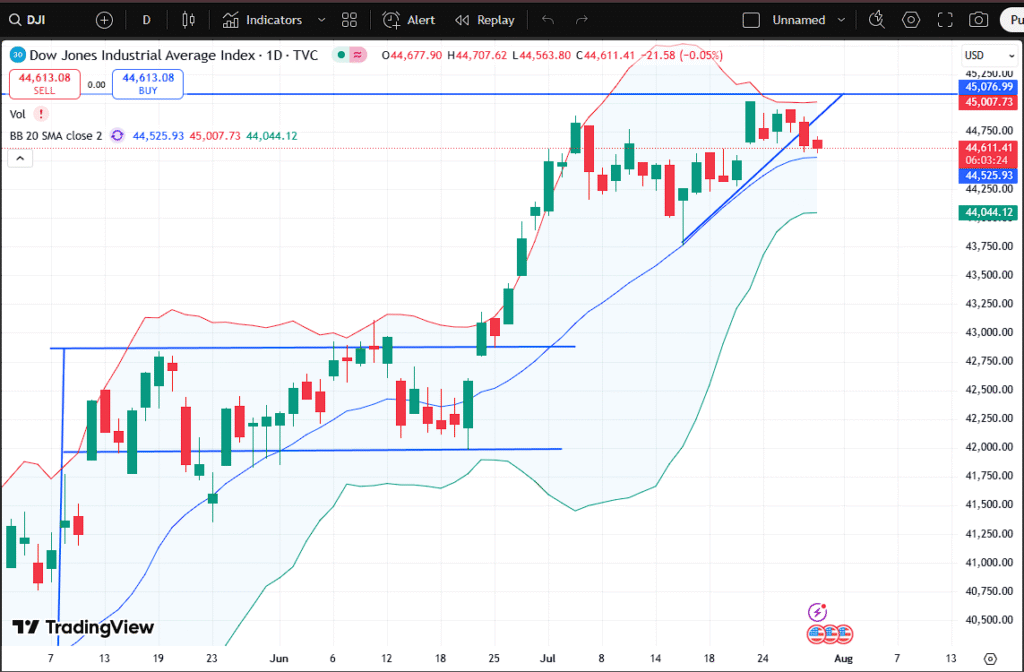
After a strong recovery phase from late June through mid-July, the Dow Jones Industrial Average faced a ceiling near the 45,200 mark—tested multiple times without success. This resistance level now acts as a psychological and technical barrier for further gains. On July 30, the index closed at 44,611.41, down by 21.58 points, and fell below its rising trendline support. This development is noteworthy, as trendline breakdowns often precede market corrections, especially after sharp rallies.
This technical setback suggests caution. Traders relying on momentum may begin to unwind positions, especially as the DJIA struggles to break above a triple-top pattern near 45,076–45,200. The current consolidation range between 44,000 and 45,000 now becomes critical, with a breakdown potentially exposing the index to deeper levels near 43,800 or even 43,300, which acted as the previous support base in early June.
The Bollinger Bands also hint at contraction in volatility. With price action hovering around the middle band (~44,525), this level serves as the first dynamic support. A decisive break below this zone could push the Dow toward the lower Bollinger Band at ~44,044, marking a possible 3-day drop zone if selling intensifies.
Additionally, the absence of significant buying volume during this pullback indicates a lack of conviction among bulls. Unless buying resumes with strong volume support, the index may face an extended period of consolidation or downside pressure.
Why August Could Be a Pivotal Month for Equities
As the market moves into August, several macroeconomic and technical factors could play a decisive role in shaping investor sentiment. Historically, August has been a volatile month for U.S. equity markets, often reacting to earnings surprises, geopolitical uncertainties, and seasonal weakness.
The Federal Reserve’s upcoming commentary on inflation and interest rate policy will also heavily influence market movement. With inflation easing but wage pressure remaining, investors anticipate a “data-dependent” tone from the Fed. This uncertainty may fuel market choppiness, especially in large-cap indices like the DJIA.
Moreover, corporate earnings season continues to unfold. While tech-heavy indices have seen stronger gains, many Dow components—such as Caterpillar, Johnson & Johnson, and Boeing—face margin pressure and international demand risks. If earnings disappoint, the Dow could underperform peers like the S&P 500 or Nasdaq in the near term.
Furthermore, market breadth is narrowing, with fewer stocks driving the index higher. Such conditions often precede reversals or corrections. Technical traders are particularly wary of bearish divergence forming in momentum indicators like the Relative Strength Index (RSI), which has failed to confirm new highs.
What Traders Should Watch: Key Levels and Scenarios
Key support and resistance levels to watch in the Dow Jones Industrial Average.
With the DJIA currently hovering near 44,600, the immediate level to monitor is the 44,525–44,500 zone, marked by the 20-day simple moving average (SMA) and Bollinger mid-band. If this level holds, we might see a short-term bounce back toward the 45,000 level. However, failure to maintain this support could trigger a fall toward the 44,044 level, aligned with the lower Bollinger Band.
Bearish Scenario:
- Close below 44,525 with increased volume.
- Next support levels: 44,044 → 43,800 → 43,300.
- Possible sentiment shift to risk-off assets (bonds, gold).
Bullish Scenario:
- Strong rebound from 44,525 with bullish candlestick reversal pattern.
- Breakout above 45,200 with high volume confirms continuation.
- Upside targets: 45,500 → 45,750 zone.
Investors are also advised to monitor Dow futures, global cues from Europe and Asia, and economic indicators like U.S. consumer spending, jobs data, and manufacturing output. Any surprise deviation from expectations can act as a trigger point in this fragile setup.
Conclusion: Is Dow’s Rally Losing Steam or Just Consolidating?
The Dow Jones Industrial Average is currently at a crossroads. While the index has gained over 2,000 points since its June lows, signs of exhaustion are emerging. The failure to break above 45,200, along with a breach of trendline support, is a technical red flag. Yet, the broader uptrend remains intact unless the Dow breaks below 43,800 on a closing basis.
Going forward, traders should stay nimble and maintain a risk-managed approach, especially ahead of macro events. For long-term investors, this may be an opportunity to accumulate fundamentally strong stocks on dips, but only after key support levels are respected.
Whether the Dow is simply pausing before another leg higher—or preparing for a deeper correction—will depend on how it performs in the coming sessions. Until then, the focus remains on volume, support levels, and broader market cues.
Disclaimer:
This article is for informational and educational purposes only. It does not constitute investment advice. Always consult a certified financial advisor before making any financial decisions.


5gbet10, huh? Name’s kinda catchy! Did a quick scroll and seems like standard stuff. Maybe worth a look if you’re looking for new places to get your bets on. Here’s the link: 5gbet10
Zahlreiche bekannte und weniger bekannte Spieleentwickler
sorgen dafür, dass die Spielauswahl möglichst abwechslungsreich ausfällt.
Darunter sind vor allem Slots, aber auch einige Tischspiele, Live Casino Spiele und Game Shows vertreten. Als Kontaktmöglichkeiten stehen E-Mail (-casino.com)
und Live Chat zur Verfügung.
Das willkommenspaket von Golden Star Casino umfasst einen gestaffelten einzahlungsbonus
über drei einzahlungen mit insgesamt bis zu
1.000 euro plus 300 freispiele für neue spieler. Diese gratis bonus aktionen werden meist als freispiele ohne einzahlung oder kleiner
sofort bonus nach der registrierung gewährt, um das casino
kostenlos zu testen. Golden Star Casino bietet gelegentlich
einen bonus ohne einzahlung für neue spieler, der jedoch nicht permanent verfügbar ist.
Die bonusbedingungen erfordern eine mindesteinzahlung von €30, um den casino bonus zu
aktivieren, während die 60 freispiele täglich über zehn tage verteilt werden.
Ziemlich praktisch, wenn du unterwegs mal eine Runde spielen willst,
oder? Sobald du sie installiert hast, kannst du
eigentlich alles machen, was auch auf der Desktop-Version geht – Boni aktivieren, um echtes
Geld spielen, das komplette Programm eben. Die deutsche Version läuft ziemlich gut auf aktuellen Android-Geräten. Das responsive design gewährleistet kompatible Funktionalität auf allen Geräten zum spielen von echtgeldspielen.
Die casino app steht als APK-download für Android verfügbar, während iOS-Spieler die optimierte Browser-Version nutzen können.
Ja, Golden Star Casino bietet eine mobile app für Android-Nutzer sowie eine vollständig responsive mobile version für alle smartphone-Betriebssysteme.
References:
https://online-spielhallen.de/mr-bet-casino-aktionscode-ihr-schlussel-zu-exklusiven-vorteilen/
Leon Casino hei\\u00dft neue Spieler mit einem Willkommensbonus von bis zu 500 \\u20ac willkommen. Das frische und moderne Online-Casino wird von einem erfahrenen Betreiber geführt, der zu den angesehensten Anbietern für Glücksspiele im Internet zählt.
Genießen Sie zusätzlich +50 Jackpot-Freispiele auf dem Royal Fortune Wheel mit einem Einsatzanforderung
von 40x. Erleben Sie den Kingmaker Willkommensbonus, bei dem neue Spieler einen 100% Bonus bis
zu 500€ mit einer Mindesteinzahlung von 20€ erhalten können. Neukunden haben nach der
ersten Einzahlung den doppelten Betrag zum Spielen zur
Verfügung und bekommen sogar noch 100 Freispiele extra geschenkt.
Was sich hinter all diesen verschiedenen Angeboten verbirgt und wofür so ein Willkommensbonus eigentlich gut
ist, das klären wir für Sie auf.
In diesem Abschnitt werden wir die beliebtesten Arten von Casino Boni untersuchen, die
den deutschen Spielern zur Verfügung stehen, um zu verstehen, wie Sie
Ihre Vorteile maximieren und das Beste aus diesen Angeboten machen können. Alle haben eine praktikable Lizenz
und folgen den deutschen Gesetzen. Ausgestellt wurde,
ist ein entscheidender Faktor für die Spieler, um sicherzustellen, dass sie in einer sicheren, regulierten Umgebung spielen. Dieses Gesetz bietet eine rechtliche Grundlage für Online Casinos, um in einer kontrollierten Umgebung zu operieren, um sicherzustellen, dass sie strenge Regeln einhalten und den Spielern eine sichere Erfahrung bieten. Wenn Sie ein Online Casino mit der
Deutschen Lizenz auswählen, ist es notwendig zu verstehen, welcher Unterschied zwischen einem wirklich “deutschen” Casino von anderen ist.
References:
https://online-spielhallen.de/plinko-casino-cashback-ihr-weg-zu-mehr-spielguthaben/
Mittlerweile bieten viele Casinos diese Boni in Form von Paketen über
mehrere Einzahlungen hinweg – oftmals in Kombination mit Freispielen. Doch es gibt
auch eine Menge erfahrener Amateur- und Profispieler,
die mit hohen Einsätzen spielen. Für neue Spieler gibt
es einen Willkommensbonus bis 100€ plus 50 Freispiele ab 10€ Mindesteinzahlung.
Dann schreibe uns eine E-Mail an -casinos.de Derzeit dürfen nur Casinos mit offizieller
GGL-Lizenz ihre Online-Glücksspiele in Deutschland legal anbieten. Die besten Online-Casinos Deutschlands bieten ihren Kunden umfangreiche
Bonusangebote.
Unter den vielen legalen Online Casinos und Spielotheken in Deutschland kann es schwierig sein, den richtigen Anbieter für sich
zu finden. Am Ende entscheidet dann aber schließlich der persönliche Geschmack, welches die beste Option ist.
Die besten Online Casinos und Spielotheken in Deutschland zeichnen sich durch ein großes Spielangebot, gute Boni und schnelle
Zahlungen aus. Bei den Slot-Spielen der besten Online Casinos und Spielotheken in Deutschland liegen die Auszahlungsquoten durchschnittlich
bei etwa 95%. Setze dir zunächst ein klares Budget und spiele verantwortungsbewusst,
um Verluste zu begrenzen. In Deutschland unterliegen lizenzierte Anbieter
strengen Vorgaben, die auch den Support betreffen.
References:
https://online-spielhallen.de/lukki-casino-aktionscode-dein-weg-zu-mehr-spielspas-und-gewinnen/
Just gave hackerslotpg a whirl! Not bad, decent graphics and a few lucky spins. Gonna check it out again later I think. hackerslotpg
Blackjack tournaments are also a chief feature at the Country Club Casino, typically boasting a minimum $3,000 prize pool (often much more) and also organised in a three elimination heats then finals table format (scheduled
at specific times). Tables are open from 2pm to 1am Sundays to Thursday,
and from 1pm to 3am on Fridays and Saturdays. Tasmania is home to two
licensed land based casino venues – the Wrest Point Hotel Casino in Hobart and the Country Club Casino in Launceston. Dive in the deep end of the
pool, and enjoy the wading pool, sauna, and spa hot tub.
The fully equipped gym has modern exercise equipment including exercise bikes,
rowing machines, treadmills and free weights.
Our playgrounds are designed for use by 4 to 12 year old children,
who must be under adult supervision at all times.
Join us for Tasmania’s biggest and best bingo with a $1,000
promotional game every week.Bingo is held every Wednesday in the Showroom.
The Range will be open seven days a week The bar and restaurant will feature function spaces, and there will be parties and event packages
available to book.
The Range will be a total golf entertainment experience
for both serious golfers, and those looking for some competitive fun! Play all day – one
entry, unlimited fun. With everything sorted ahead of time,
all that’s left to do is swing, laugh, and enjoy
the moment together. Watergarden is enjoyed by guests and visitors as a place to enjoy casual, bistro-style dining in a convenient,
accessible location.
References:
https://blackcoin.co/play-at-wild-fortune-online-casino/
I’m personally not a big fan of these, to be honest, but the number of players logging bets
onto them at every casino website says they are nearly as popular as
table games. Many of the top gambling sites in Australia now have a fully gamified system with
challenges and quests that you can complete to earn real money prizes.
I reviewed the best online casino bonuses with more than just the bonus amount in mind.
But I do know better, and this gambling website is a good
fit for anyone looking to play casino games – whether a high roller
or a low budget player. Okay, yes, it’s good that all players are eligible for cashback (starting
at 5% and going up depending on losses), but we need to be real that very, very few can actually benefit from this offer.
That’s not to say you won’t find table and live dealer games
(there are over 500), but pokies are where Neospin really delivers.
So you’ve heard what our experts have to say and you’re all
set to start playing at an Australia casino online.
Here is a quick breakdown of some of the leading games that we offer for free.
Let’s take a look at the most popular among Australian casino site players.
Instead, they give access to free casino games.
So what features does the best Australian online casino possess?
References:
https://blackcoin.co/popular-variations-of-casino-slots-game-rules-and-descriptions/
To activate this offer, make a deposit of at least A$45 and enter the bonus code “50WINFS” in the cashier section. The Spin Your Week promotion delivers 50 free spins to your account once per week, providing an excellent opportunity to enjoy premium
pokies without risking your own funds. These recurring
offers provide regular opportunities to boost your bankroll and extend your playing
time, making every week at King Billy something to look forward to.
Beyond the generous welcome package, King Billy Casino ensures its loyal Australian players are continuously rewarded with a variety of weekly promotions.
Your third deposit brings the biggest potential bonus amount
in the welcome package.
It’s great to know that your personal manager has been helpful and that you’ve had positive
interactions.If you ever have additional suggestions or need assistance, our
support team is always available to help.Long Live James!
Your Grace James,Thank you for sharing your experience with us.
I never heard anything more about the bonus I never
received. Shortly after it all appeared fixed but by that time
I didn’t have very much from my small deposit. The live
chat isn’t functioning, so I could only send them a message which took them hours
to respond. According to our records, the issue has since been resolved and your withdrawal was successfully
processed.
No other social casino slots game offers what Cashman Casino
does, with MEGA virtual bonuses every day,
hour, and 15 MINUTES! We work hard to make sure you get the most out of your banking relationship with
us and receive the financing your business needs at every
stage of its growth story. We have decades of experience helping large and small companies manage all their banking needs.
Our accounts cover all your everyday business banking needs, from basic checking
account to interest earning accounts and flexible deposit.
We are committed to helping you explore opportunities, and
our suite of value-enhanced business banking packages are designed to help you and your business stay ahead of
the curve. Transform your business with our dedicated team of
experts & effortless online banking.
Power up your business with online banking solutions & personalised support.
With our online services, applying for your business account is hassle-free and convenient.
When you register with your credit card, you will have access
only to the information and services related to
your credit card. We’ve now lifted the bar higher than ever by completely revamping
the app to deliver your banking needs significantly faster with an enhanced user interface.
Future Lab™ is our strategic think tank and testing center dedicated to future-proofing the bank,
and we achieve this through collaboration with leading
industry players. Learn more about our services and get the most out of your banking relationship
with us.
The combination of quality games, generous rewards, and community features creates an engaging experience that rivals traditional casino gaming while remaining completely risk-free.
Free play gaming eliminates the pressure of real money wagering while preserving all the entertainment value of traditional casino games.
Practice or success at social gaming does not imply future success at gambling.The creators who brought the Heart of
Vegas slots game bring you another free slot experience with a collection of Aristocrat social casino games that
you love! You’ll benefit from business banking services and financing solutions that help you stay on top of cash flow and maximise the potential of your organisation’s financial assets.
This variety means players can switch between classic fruit machines, adventure-themed video slots, and progressive jackpot games all within the same platform.
The game includes golden dragon scatters, free spins features,
and even a Buy Free Spins option for players who want immediate bonus access.
References:
https://blackcoin.co/free-bets-how-to-play-for-free-in-online-casino-and-poker-rooms/
It is likely to remain the only casino in South Australia for some time.
While Skycity is still in control of the casino, the name
was changed back to Adelaide Casino in 2009.
Visitors will find spectacular restaurants, superb bars, and an overall pleasant ambiance in addition to great gaming.
You will find 200 table games, 1500 pokie machines,
VIP sections, a dedicated poker zone, and three methods to
play roulette. You can review your choices and withdraw
your consent at any time by clicking the ’Privacy Preferences’ link in the page side navigation.
Peppers Waymouth Hotel offers spacious modern accommodation with stunning
views across the city. In a prime location in Adelaide, Hotel Alba Adelaide provides air-conditioned rooms, an outdoor swimming pool, free WiFi and a fitness centre.
Situated in Adelaide, 1.1 km from Rundle Mall, Vibe Hotel Adelaide features accommodation with an outdoor swimming
pool, private parking, a fitness centre and a terrace.
Nearly 1,000 different gaming machines in values ranging
from 0.01 to 1.00 AUD are available at the casino.
Adelaide Casino is the only casino in South Australia for players wishing to have a good time.
The Adelaide Casino promises next-level entertainment and a comprehensive gaming experience.
References:
https://blackcoin.co/welcome-bonus-the-ultimate-guide/
Regardless of the bonus, gamblers must complete the wagering terms to withdraw
this money. Players can reveal the grand prize by depositing a minimum
of $/€40. What’s more, loyal members can get free spins each Monday.
Deposits start at just 10 EUR/USD, and there are no extra fees from the casino’s side.
In this case, they don’t need to download a National Casino mobile app.
Users can keep gambling even if they cannot access
their PCs.
References:
https://blackcoin.co/best-big-time-gaming-casinos/
online casino paypal einzahlung
References:
pridestaffing.us
australian online casinos that accept paypal
References:
externalliancerh.com
casino online paypal
References:
https://vads.in/
online casino paypal
References:
etalent.zezobusiness.com
online betting with paypal winnersbet
References:
udyogseba.com
online australian casino paypal
References:
job-bee.com
paypal casino canada
References:
precisionscans.net
best online casino usa paypal
References:
https://classihub.in/author/brodiebrien
Yo, gold365app is worth a look! Smooth performance and a decent variety of games. Not gonna lie, I’m hooked. Find them here: gold365app
Just wanted to say hello8822 is actually getting some love from me. It’s not bad, give it a try. I think you guys will love it! Found them here: hello8822
Really digging ka9game! The interface is clean and the games are fun. Check it out! Here’s the link: ka9game
Thank you for your sharing. I am worried that I lack creative ideas. It is your article that makes me full of hope. Thank you. But, I have a question, can you help me? https://accounts.binance.com/register-person?ref=QCGZMHR6