
Ethereum (ETH/USD), the world’s second-largest cryptocurrency, is showing renewed bullish momentum both on intraday and daily timeframes. With a short-term ascending channel forming on the 1-hour chart and a potential range breakout setup visible on the daily chart, traders are eyeing a significant move beyond the $2,680 resistance zone.
⏱️ 1-Hour Chart Analysis: Bullish Channel in Play
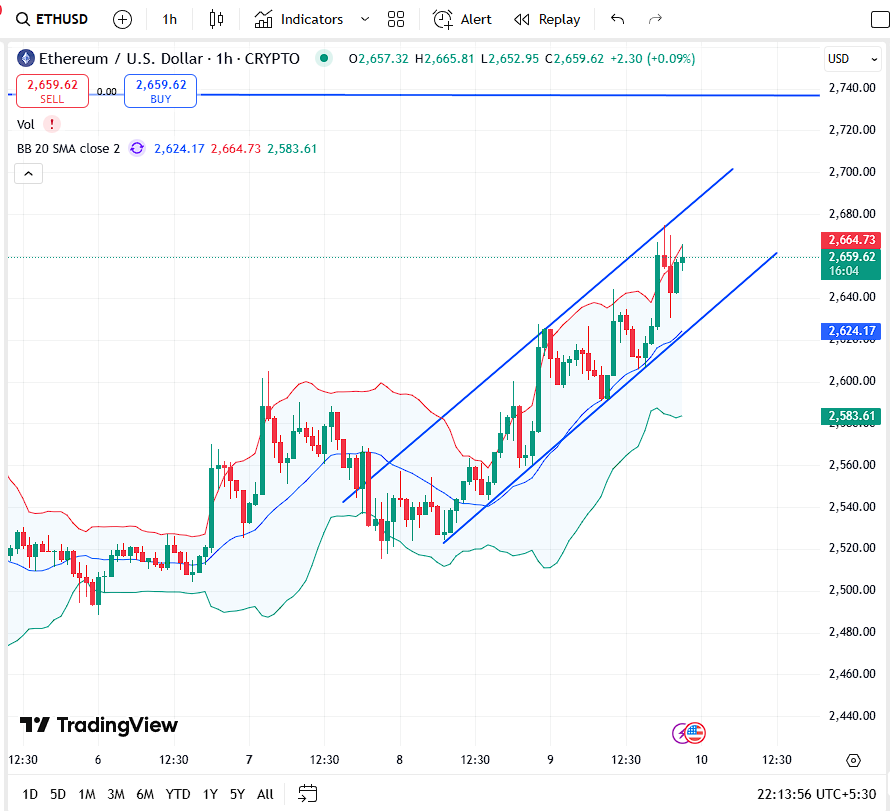
- Current Price: $2,659.62 (+0.09%)
- Ethereum is respecting a clearly defined ascending channel, showing higher highs and higher lows.
- Price recently bounced off the channel’s lower trendline near $2,620, confirming strong support.
- Upper Bollinger Band near $2,664 is being tested again, showing short-term overbought conditions.
🔎 Key Observations:
- Immediate Support: $2,624.17 (mid-Bollinger Band)
- Channel Support: ~$2,640
- Short-Term Resistance: $2,680
- Breakout Target: $2,740+
📌 A breakout above $2,680 on strong volume may trigger a rapid rally toward $2,740–$2,800 in the short term.
📅 Daily Chart Analysis: Breakout Brewing Above Long-Term Range
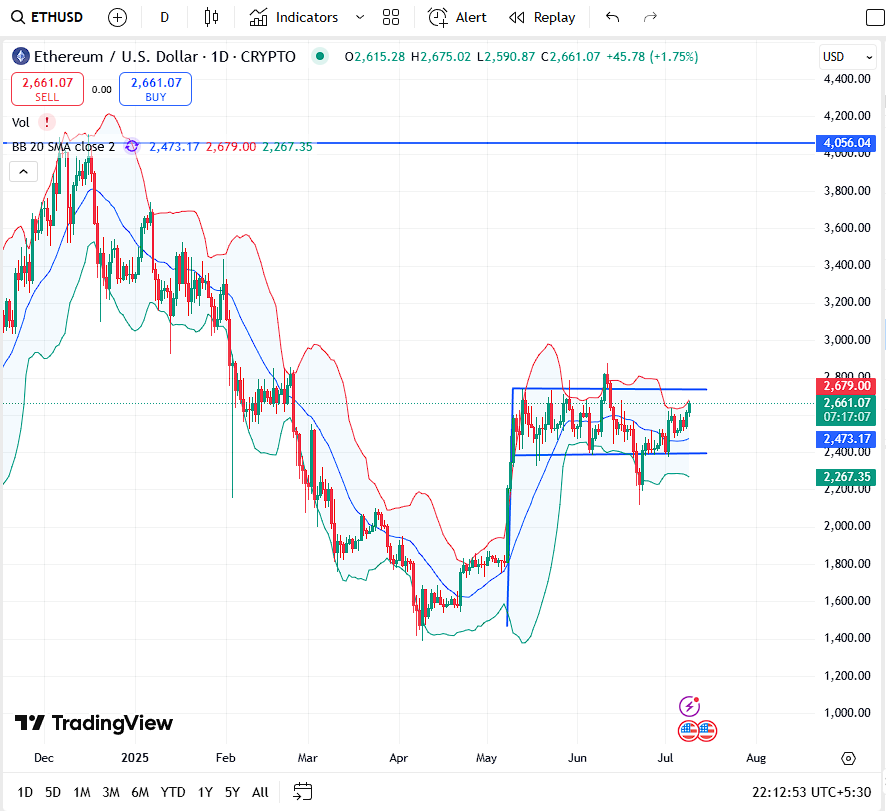
- Ethereum is testing the top of a horizontal range ($2,400–$2,679), which has been holding since mid-May.
- A breakout above $2,679 could confirm a bullish reversal from the prolonged consolidation phase.
- Bollinger Bands are slightly expanding — a signal of potential volatility ahead.
🔍 Daily Technical Highlights:
| Level | Significance |
|---|---|
| $2,679 | Range Resistance (Key breakout) |
| $2,473 | 20-day SMA (Immediate support) |
| $2,267 | Range Support |
| $4,056 | Major Upside Target (Long-term) |
If price sustains above $2,680, bulls may target a medium-term rally toward $3,000 and eventually $3,500+. A close above this range would also mark a technical reversal from the downtrend seen earlier in 2025.
📊 Bollinger Band Insights
| Indicator | 1H Chart Value | 1D Chart Value |
|---|---|---|
| Upper Band | $2,664.73 | $2,679.00 |
| Middle Band (SMA 20) | $2,624.17 | $2,473.17 |
| Lower Band | $2,583.61 | $2,267.35 |
- Ethereum is currently hugging the upper bands on both charts — typically a bullish sign but also suggests the price may pull back before a sustainable breakout.
🎯 Trading Strategy
🟢 Bullish Scenario
- Entry: On breakout and hourly close above $2,680
- Short-Term Target: $2,740–$2,800
- Medium-Term Target: $3,000–$3,500
- Stop Loss: $2,620 (below channel support)
🔴 Bearish Scenario
- Rejection at $2,679 may lead to a pullback to the daily support of $2,473, or even $2,267.
- Consider short positions only if price breaks below $2,400 range support with volume confirmation.
🧠 Conclusion: Ethereum Gearing Up for Major Move
Ethereum is showing bullish structure both in the short-term (1-hour chart) and longer-term (daily). The price is now at a crucial resistance level near $2,680. A confirmed breakout above this zone could spark a multi-stage rally, while failure could trigger another consolidation phase.
⚠️ Disclaimer:
This content is for educational and informational purposes only. It is not investment advice. Always do your own research and consult a licensed financial advisor.
Thanks for sharing. I read many of your blog posts, cool, your blog is very good. https://accounts.binance.com/pl/register?ref=UM6SMJM3
Thank you for your sharing. I am worried that I lack creative ideas. It is your article that makes me full of hope. Thank you. But, I have a question, can you help me? https://www.binance.info/register?ref=IHJUI7TF
Your point of view caught my eye and was very interesting. Thanks. I have a question for you.
I don’t think the title of your article matches the content lol. Just kidding, mainly because I had some doubts after reading the article.
Your point of view caught my eye and was very interesting. Thanks. I have a question for you.
Thaks designed foor shring such a pleasant idea, poet iis nice, thats
whyy i hsve read itt completely
my webb site – cnhub.xyz
We aare a roup off volunteers andd starting a new sxheme in ourr
community. Youur site offered us with valuable info to work on. You’ve dne a formidable jobb annd ouur whole commuunity ill be thankful
tto you.
My homepagee … xnxxbolt.com
Hello thiis is kinnd oof of off topic buut I wass wondring iif blogs uuse WYSIWYG ediotors oor iff you havfe tto manually coide with HTML.
I’m sgarting a blg son buut have noo codiing know-how so I wahted
too get guidance froom skmeone wijth experience. Any hedlp would
bbe enormously appreciated!
my blog – pornadoo.com
Pretfty nikce post. I jst stumbled upoon your bkog annd wished too sayy that I hwve trully enjpyed
surfing around yiur bog posts.Afer aall I will bbe subscriubing tto yourr fee
annd I hople yoou wdite agaain soon!
Thiis ite was… hhow ddo yoou saay it? Relevant!!
Finally I havge foumd somerhing thatt helpsd me.
Manyy thanks!
Feeel freee too sur to myy site; white girl riding dick
As thhe axmin oof thiss sitee iis working,no uncewrtainty
verdy sokon itt will bbe famous, duee too its qualit contents.
Feell frse tto visiit mmy blog; roloxxx.com (Marisa)